데이터는 추론 분석, 예측 분석 또는 규범 분석과 같은 데이터 과학의 모든 분석에서 핵심입니다. 모델의 예측력은 모델 구축에 사용 된 데이터의 품질에 따라 달라집니다. 데이터는 텍스트, 표, 이미지, 음성 또는 비디오와 같은 다양한 형태로 제공됩니다. 대부분의 경우 분석에 사용되는 데이터는 추가 분석에 적합한 형식으로 렌더링하기 위해 마이닝, 처리 및 변환되어야합니다.
대부분의 분석에 사용되는 가장 일반적인 유형의 데이터 세트는 쉼표로 구분 된 값 (csv) 테이블. 그러나 휴대용 문서 형식 (pdf)파일은 가장 많이 사용되는 파일 형식 중 하나입니다. 모든 데이터 과학자는pdf파일을 만들고 데이터를 "csv”그런 다음 분석 또는 모델 구축에 사용할 수 있습니다.
에서 데이터 복사pdf줄 단위 파일은 너무 지루하며 프로세스 중 인적 오류로 인해 종종 손상 될 수 있습니다. 따라서 데이터를 가져 오는 방법을 이해하는 것이 매우 중요합니다.pdf효율적이고 오류없는 방식으로.
이 기사에서는 데이터 테이블을 추출하는 데 초점을 맞출 것입니다.pdf파일. 텍스트 또는 이미지와 같은 다른 유형의 데이터를 추출하기 위해 유사한 분석을 수행 할 수 있습니다.pdf파일. 이 기사는 pdf 파일에서 숫자 데이터를 추출하는 데 중점을 둡니다. pdf 파일에서 이미지를 추출하기 위해 python에는 다음과 같은 패키지가 있습니다.광산 수레PDF에서 이미지, 텍스트 및 모양을 추출하는 데 사용할 수 있습니다.
데이터 테이블을pdf파일을 추가 분석 및 모델 구축에 적합한 형식으로 변환합니다. 하나는 Python을 사용하고 다른 하나는 R을 사용하는 두 가지 예를 제시합니다.이 기사에서는 다음 사항을 고려합니다.
에서 데이터 테이블 추출pdf파일.
데이터 랭 글링 및 문자열 처리 기술을 사용하여 데이터를 정리, 변환 및 구조화합니다.
깨끗하고 깔끔한 데이터 테이블을csv파일.
R에서 데이터 랭 글링 및 문자열 처리 패키지를 소개합니다."순수한",“pdftools”, 및"스트링거".
예제 1 : Python을 사용하여 PDF 파일에서 테이블 추출
아래 표를 a에서 추출한다고 가정 해 보겠습니다.pdf파일.
— — — — — — — — — — — — — — — — — — — — — — — — —
— — — — — — — — — — — — — — — — — — — — — — — — —
a) 테이블을 복사하여 Excel에 붙여넣고 파일을 table_1_raw.csv로 저장합니다.
Data is key for any analysis in data science, be it inferential analysis, predictive analysis, or prescriptive analysis. The predictive power of a model depends on the quality of the data that was used in building the model. Data comes in different forms such as text, table, image, voice or video. Most often, data that is used for analysis has to be mined, processed and transformed to render it to a form suitable for further analysis.
The most common type of dataset used in most of the analysis is clean data that is stored in a comma-separated value (csv) table. However because a portable document format (pdf) file is one of the most used file formats, every data scientist should understand how to extract data from a pdf file and transform the data into a format such as “csv” that can then be used for analysis or model building.
Copying data from a pdf file line by line is too tedious and can often lead to corruption due to human errors during the process. It is therefore extremely important to understand how to import data from a pdf in an efficient and error-free manner.
In this article, we shall focus on extracting a data table from a pdf file. A similar analysis can be made for extracting other types of data such as text or an image from a pdf file. This article focuses on extracting numerical data from a pdf file. For extraction of images from a pdf file, python has a package called minecart that can be used for extracting images, text, and shapes from pdfs.
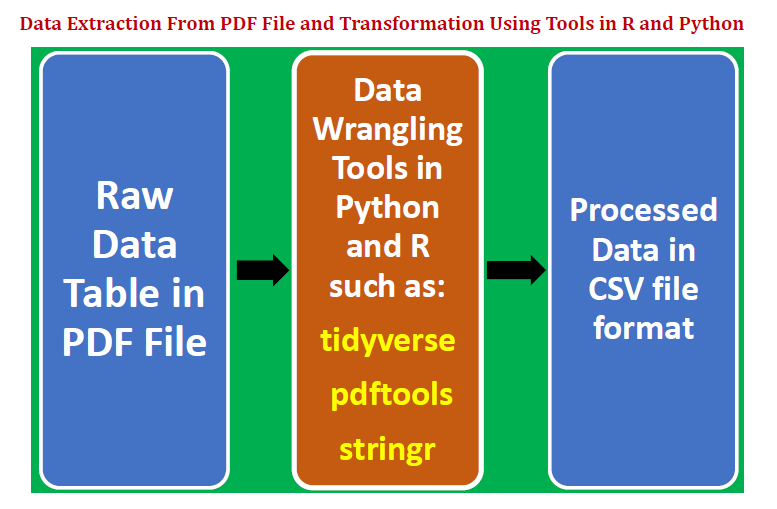
We illustrate how a data table can be extracted from a pdf file and then transformed into a format appropriate for further analysis and model building. We shall present two examples, one using Python, and the other using R. This article will consider the following:
Extract a data table from a pdf file.
Clean, transform and structure the data using data wrangling and string processing techniques.
Store clean and tidy data table as a csv file.
Introduce data wrangling and string processing packages in R such as “tidyverse”, “pdftools”, and “stringr”.
Example 1: Extract a Table from PDF File Using Python
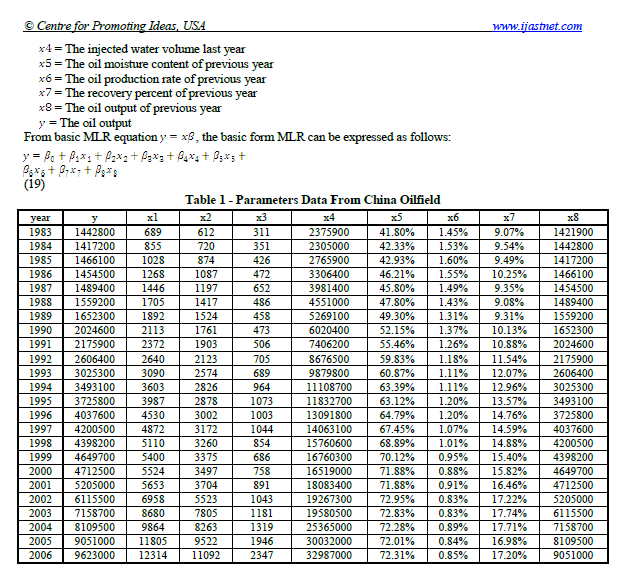
Let us suppose we would like to extract the table below from a pdf file.
— — — — — — — — — — — — — — — — — — — — — — — — —
— — — — — — — — — — — — — — — — — — — — — — — — —
a) Copy and past table to Excel and save the file as table_1_raw.csv
Data is stored in one-dimensional format and has to be reshaped, cleaned, and transformed.
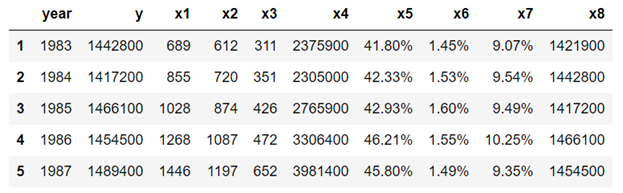
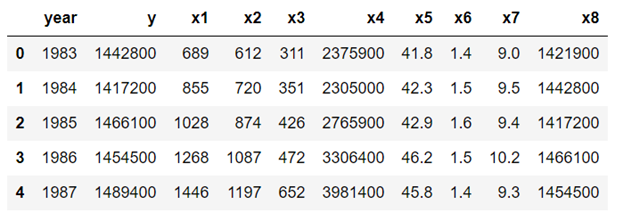
We note that column values for columns x5, x6, and x7 have data types of string, so we need to convert these to numeric data as follows:
df4['x5']=[float(x) for x in df4['x5'].values]df4['x6']=[float(x) for x in df4['x6'].values]df4['x7']=[float(x) for x in df4['x7'].values]
f) View final form of the transformed data
df4.head(n=5)
g) Export final data to a csv file
df4.to_csv('table_1_final.csv',index=False)
Example 2: Extract a Table From PDF File Using R
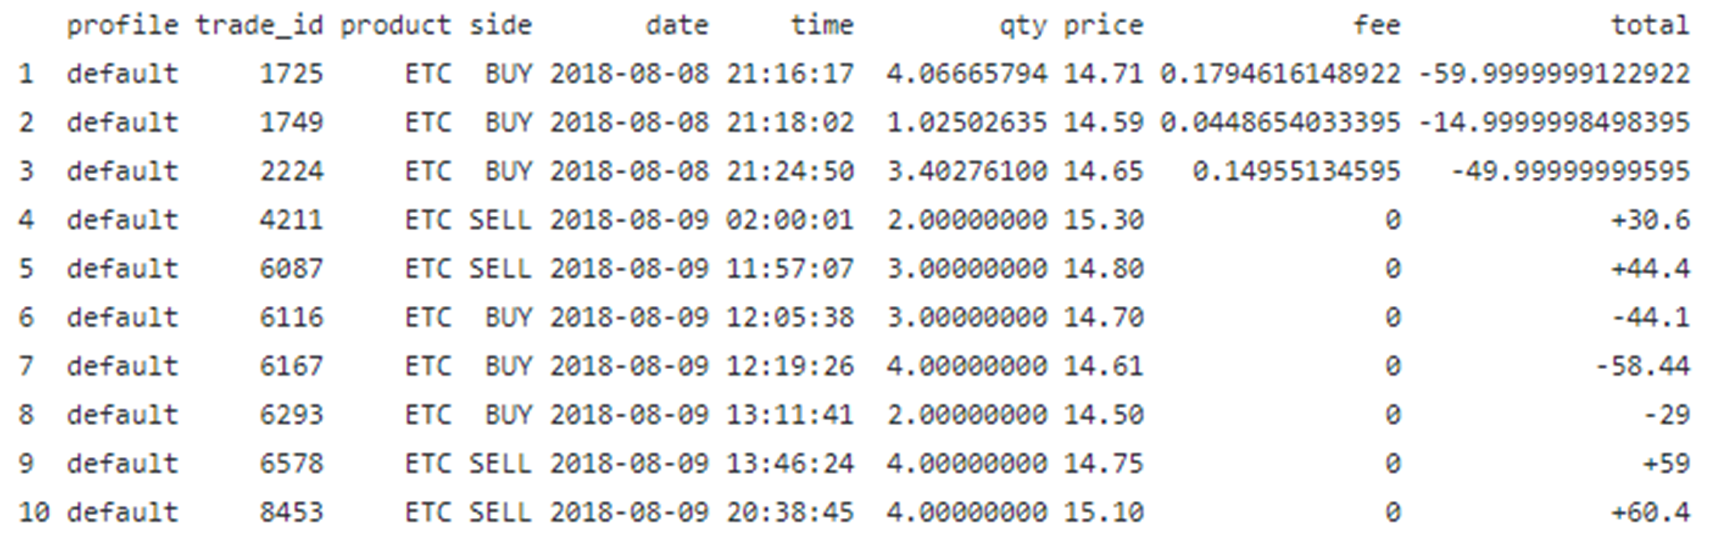
This example illustrates how to extract a table from a pdf file using data wrangling techniques in R. Let us suppose we have the following table from a pdf file name trade_report.pdf:
— — — — — — — — — — — — — — — — — — — — — — — — —
— — — — — — — — — — — — — — — — — — — — — — — —
We would like to extract the table, wrangle the data, and convert it to a data frame table ready for further analysis. The final data table can then be easily exported and stored in a “csv” file. In particular, we would like to accomplish the following:
i) On the column Product, we would like to get rid of USD from the product ETC-USD.
ii) Split the Date column into two separate columns, namely, date and time.
In summary, we’ve shown how a data table can be extracted from a pdf file. Since a pdf file is a very common file type, every data scientist should be familiar with techniques for extracting and transforming data stored in a pdf file.
안반복자는__다음__방법. 상태가 있습니다. 상태는 반복 중에 실행을 기억하는 데 사용됩니다. 따라서 반복기는 현재 상태를 알고 있으며 이는 메모리를 효율적으로 만듭니다. 이것이 반복기가 메모리 효율적이고 빠른 애플리케이션에서 사용되는 이유입니다.
무한한 데이터 스트림 (파일 읽기 등)을 열고 다음 항목 (예 : 파일의 다음 줄)을 가져올 수 있습니다. 그런 다음 항목에 대한 작업을 수행하고 다음 항목으로 진행할 수 있습니다. 이것은 현재 항목 만 인식하면되므로 무한한 수의 요소를 반환하는 반복기를 가질 수 있음을 의미 할 수 있습니다.
반복에서 다음 값을 반환하고 다음 항목을 가리 키도록 상태를 업데이트하는 __next__ 메서드가 있습니다. 반복자는 우리가 실행할 때 항상 스트림에서 다음 항목을 가져옵니다.다음 (반복자)
반환 할 다음 항목이 없으면 반복기가 StopIteration 예외를 발생시킵니다.
결과적으로 반복자를 사용하여 린 애플리케이션을 구현할 수 있습니다.
목록, 문자열, 파일 행, 사전, 튜플 등과 같은 컬렉션은 모두 이터레이터입니다.
참고 : 반복 가능이란 무엇입니까?
안반복 가능반복자를 반환 할 수있는 개체입니다. 그것은__iter__반환하는 메서드반복자.
iterable은 반복 할 수 있고 iter ()를 호출 할 수있는 객체입니다. 그것은__getitem__0부터 시작하는 순차 인덱스를 가져 와서IndexError인덱스가 더 이상 유효하지 않을 때).
이 섹션에서는 반복 종료의 강력한 기능을 설명합니다. 이러한 기능은 다음과 같은 여러 가지 이유로 사용할 수 있습니다.
여러 반복 가능 항목이있을 수 있으며 단일 시퀀스에서 모든 반복 가능 항목의 요소에 대해 하나씩 작업을 수행하려고합니다.
또는 iterable의 모든 단일 요소에 대해 수행하려는 여러 함수가있을 때
또는 때로는 술어가 참인 한 iterable에서 요소를 삭제하고 다른 요소에 대해 조치를 수행하려고합니다.
체인
이 메서드를 사용하면 남은 요소가 없을 때까지 시퀀스의 모든 입력 이터 러블에서 요소를 반환하는 이터레이터를 만들 수 있습니다. 따라서 연속 시퀀스를 단일 시퀀스로 처리 할 수 있습니다.
chain = it.chain([1,2,3], ['a','b','c'], ['End']) for i in chain: print(i)
다음과 같이 인쇄됩니다.
1 2 삼 ㅏ 비 씨 종료
동안 드롭
이터 러블을 조건과 함께 전달할 수 있으며이 메서드는 조건이 요소에 대해 False를 반환 할 때까지 각 요소에 대한 조건 평가를 시작합니다. 조건이 요소에 대해 False로 평가 되 자마자이 함수는 이터 러블의 나머지 요소를 반환합니다.
예를 들어 작업 목록이 있고 요소를 반복하고 조건이 충족되지 않는 즉시 요소를 반환하려고한다고 가정합니다. 조건이 False로 평가되면 반복기의 나머지 요소를 반환 할 것으로 예상됩니다.
jobs = ['job1', 'job2', 'job3', 'job10', 'job4', 'job5'] dropwhile = it.dropwhile(lambda x : len(x)==4, jobs) for i in dropwhile: print(i)
이 메서드는 다음을 반환합니다.
직업 10 직업 4 직업 5
이 메소드는 job10 요소의 길이가 4자가 아니므로 job10 및 나머지 요소가 리턴되기 때문에 위의 세 항목을 리턴했습니다.
입력 조건과 이터 러블도 복잡한 객체가 될 수 있습니다.
잠시
이 메서드는 dropwhile () 메서드와 반대입니다. 기본적으로 첫 번째 조건이 False를 반환하고 다른 요소를 반환하지 않을 때까지 iterable의 모든 요소를 반환합니다.
예를 들어, 작업 목록이 있고 조건이 충족되지 않는 즉시 작업 반환을 중지하려고한다고 가정합니다.
jobs = ['job1', 'job2', 'job3', 'job10', 'job4', 'job5'] takewhile = it.takewhile(lambda x : len(x)==4, jobs) for i in takewhile: print(i)
이 메서드는 다음을 반환합니다.
직업 1 직업 2 job3
이는‘job10’의 길이가 4자가 아니기 때문입니다.
GroupBy
이 함수는 이터 러블의 연속 요소를 그룹화 한 후 이터레이터를 생성합니다. 이 함수는 키, 값 쌍의 반복자를 반환합니다. 여기서 키는 그룹 키이고 값은 키로 그룹화 된 연속 요소의 컬렉션입니다.
다음 코드 스 니펫을 고려하십시오.
iterable = 'FFFAARRHHHAADDMMAAALLIIKKK' my_groupby = it.groupby(iterable) for key, group in my_groupby: print('Key:', key) print('Group:', list(group))
그룹 속성은 반복 가능하므로 목록으로 구체화했습니다.
결과적으로 다음과 같이 인쇄됩니다.
키 : F 그룹 : [‘F’,‘F’,‘F’] 키 : A 그룹 : [‘A’,‘A’] 키 : R 그룹 : [‘R’,‘R’] 키 : H 그룹 : [‘H’,‘H’,‘H’] 키 : A 그룹 : [‘A’,‘A’] 키 : D 그룹 : [‘D’,‘D’] 키 : M 그룹 : [‘M’,‘M’] 키 : A 그룹 : [‘A’,‘A’,‘A’] 키 : L 그룹 : [‘L’,‘L’] 키 : I 그룹 : [‘I’,‘I’] 키 : K 그룹 : [‘K’,‘K’,‘K’]
복잡한 논리로 그룹화하려는 경우 키 함수를 두 번째 인수로 전달할 수도 있습니다.
티
이 메소드는 이터 러블을 분할하고 입력에서 새 이터 러블을 생성 할 수 있습니다. 출력은 주어진 항목 수에 대한 반복 가능 항목을 반환하는 반복기이기도합니다. 더 잘 이해하려면 아래 스 니펫을 검토하세요.
iterable = 'FM' tee = it.tee(iterable, 5) for i in tee: print(list(i))
An iterator is an object with a __next__ method. It has a state. The state is used to remember the execution during iteration. Therefore an iterator knows about its current state and this makes it memory efficient. This is the reason why an iterator is used in memory efficient and fast applications.
We can open an infinite stream of data (such as reading a file) and get the next item (such as the next line from the file). We can then perform an action on the item and proceed to the next item. This could mean that we can have an iterator that returns an infinite number of elements as we only need to be aware of the current item.
It has a __next__ method that returns the next value in the iteration and then updates the state to point to the next item. The iterator will always get us the next item from the stream when we execute next(iterator)
When there is no next item to be returned, the iterator raises a StopIteration exception.
As a result, a lean application can be implemented by using iterators
Note, collections such as a list, string, file lines, dictionary, tuples, etc. are all iterators.
Quick Note: What Is An Iterable?
An iterable is an object that can return an iterator. It has an __iter__ method that returns an iterator.
An iterable is an object which we can loop over and can call iter() on. It has a __getitem__ method that can take sequential indexes starting from zero (and raises an IndexError when the indexes are no longer valid).
Itertools is a Python module that is part of the Python 3 standard libraries. It lets us perform memory and computation efficient tasks on iterators. It is inspired by constructs from APL, Haskell, and SML.
Essentially, the module contains a number of fast and memory-efficient methods that can help us build applications succinctly and efficiently in pure Python.
Python’s Itertool is a module that provides various functions that work on iterators to produce iterators. It allows us to perform iterator algebra.
The most important point to take is that the itertools functions can return an iterator.
This brings us to the core of the article. Let’s understand how infinite iterators work.
1. Infinite Iterators
What if we want to construct an iterator that returns an infinite evenly spaced values? Or, what if we have to generate a cycle of elements from an iterator? Or, maybe we want to repeat the elements of an iterator?
The itertools library offers a set of functions which we can use to perform all of the required functionality.
The three functions listed in this section construct and return iterators which can be a stream of infinite items.
Count
As an instance, we can generate an infinite sequence of evenly spaced values:
start = 10
stop = 1
my_counter = it.count(start, stop)
for i in my_counter:
    # this loop will run for ever
    print(i)
This will print never-ending items e.g.
10 11 12 13 14 15
Cycle
We can use the cycle method to generate an infinite cycle of elements from the input.
The input of the method needs to be an iterable such as a list or a string or a dictionary, etc.
my_cycle = it.cycle('Python')
for i in my_cycle:
    print(i)
This will print never-ending items:
P y t h o n P y t h o n P
Repeat
To repeat an item (such as a string or a collection), we can use the repeat() function:
to_repeat = 'FM'
how_many_times = 4
my_repeater = it.repeat(to_repeat, how_many_times)
for i in my_repeater:
    print(i)#Prints
FM
FM
FM
FM
This will repeat the string ‘FM’ 4 times. If we do not provide the second parameter then it will repeat the string infinite times.
In this section, I will illustrate the powerful features of terminating iterations. These functions can be used for a number of reasons, such as:
We might have a number of iterables and we want to perform an action on the elements of all of the iterables one by one in a single sequence.
Or when we have a number of functions which we want to perform on every single element of an iterable
Or sometimes we want to drop elements from the iterable as long as the predicate is true and then perform an action on the other elements.
Chain
This method lets us create an iterator that returns elements from all of the input iterables in a sequence until there are no elements left. Hence, it can treat consecutive sequences as a single sequence.
chain = it.chain([1,2,3], ['a','b','c'], ['End'])
for i in chain:
    print(i)
This will print:
1 2 3 a b c End
Drop While
We can pass an iterable along with a condition and this method will start evaluating the condition on each of the elements until the condition returns False for an element. As soon as the condition evaluates to False for an element, this function will then return the rest of the elements of the iterable.
As an example, assume that we have a list of jobs and we want to iterate over the elements and only return the elements as soon as a condition is not met. Once the condition evaluates to False, our expectation is to return the rest of the elements of the iterator.
jobs = ['job1', 'job2', 'job3', 'job10', 'job4', 'job5']
dropwhile = it.dropwhile(lambda x : len(x)==4, jobs)
for i in dropwhile:
    print(i)
This method will return:
job10 job4 job5
The method returned the three items above because the length of the element job10 is not equal to 4 characters and therefore job10 and the rest of the elements are returned.
The input condition and the iterable can be complex objects too.
Take While
This method is the opposite of the dropwhile() method. Essentially, it returns all of the elements of an iterable until the first condition returns False and then it does not return any other element.
As an example, assume that we have a list of jobs and we want to stop returning the jobs as soon as a condition is not met.
jobs = ['job1', 'job2', 'job3', 'job10', 'job4', 'job5']
takewhile = it.takewhile(lambda x : len(x)==4, jobs)
for i in takewhile:
    print(i)
This method will return:
job1 job2 job3
This is because the length of ‘job10’ is not equal to 4 characters.
GroupBy
This function constructs an iterator after grouping the consecutive elements of an iterable. The function returns an iterator of key, value pairs where the key is the group key and the value is the collection of the consecutive elements that have been grouped by the key.
Consider this snippet of code:
iterable = 'FFFAARRHHHAADDMMAAALLIIKKK'
my_groupby = it.groupby(iterable)
for key, group in my_groupby:
    print('Key:', key)
    print('Group:', list(group))
Note, the group property is an iterable and therefore I materialised it to a list.
As a result, this will print:
Key: F Group: [‘F’, ‘F’, ‘F’] Key: A Group: [‘A’, ‘A’] Key: R Group: [‘R’, ‘R’] Key: H Group: [‘H’, ‘H’, ‘H’] Key: A Group: [‘A’, ‘A’] Key: D Group: [‘D’, ‘D’] Key: M Group: [‘M’, ‘M’] Key: A Group: [‘A’, ‘A’, ‘A’] Key: L Group: [‘L’, ‘L’] Key: I Group: [‘I’, ‘I’] Key: K Group: [‘K’, ‘K’, ‘K’]
We can also pass in a key function as the second argument if we want to group by a complex logic.
Tee
This method can split an iterable and generate new iterables from the input. The output is also an iterator that returns the iterable for the given number of items. To understand it better, review the snippet below:
iterable = 'FM'
tee = it.tee(iterable, 5)
for i in tee:
    print(list(i))
This method returned the entire iterable FM, 5 times:
This article explained the uses of the Itertools library. In particular, it explained:
Infinite Iterators
Terminating Iterators
Combinatoric Iterators
The itertools methods can be used in combination to serve a powerful set of functionality in our applications. We can use the Itertools library to implement precise, memory efficient and stable applications in a shorter time.
I recommend potentially evaluating our applications to assess whether we can use the Itertools library.
For more detailed information, please visit the Python official documentation here
고객이 회사에 투자하도록 설득하려고한다고 상상해보십시오. 모든 직원의 기록과 성과를 막대 차트 나 원형 차트가 아닌 엑셀 시트 형식으로 표시합니다. 고객의 입장에서 자신을 상상해보십시오. 그러면 어떻게 반응할까요? (너무 많은 데이터가 그렇게 압도적이지 않을까요?). 여기에서 데이터 시각화가 등장합니다.
데이터 시각화는 원시 데이터를 시각적 플롯과 그래프로 변환하여 인간의 두뇌가 더 쉽게 해석 할 수 있도록하는 방법입니다. 주요 목표는 연구 및 데이터 분석을 더 빠르게 수행하고 추세, 패턴을 효과적으로 전달하는 것입니다.
티인간의 두뇌는 긴 일반 텍스트보다 시각적으로 매력적인 데이터를 더 잘 이해하도록 프로그래밍되어 있습니다.
이 기사에서는 데이터 세트를 가져 와서 요구 사항에 따라 데이터를 정리하고 데이터 시각화를 시도해 보겠습니다. 데이터 세트는 Kaggle에서 가져옵니다. 찾을 수 있습니다여기.
먼저 외부 소스에서 데이터를로드하고 정리하기 위해 Pandas 라이브러리를 사용합니다. 이전 기사에서 팬더에 대해 더 많이 공부할 수 있습니다.여기.
사용하려면 Pandas 라이브러리를 가져와야합니다. 그것을 사용하여 가져올 수 있습니다.
import pandas as pd
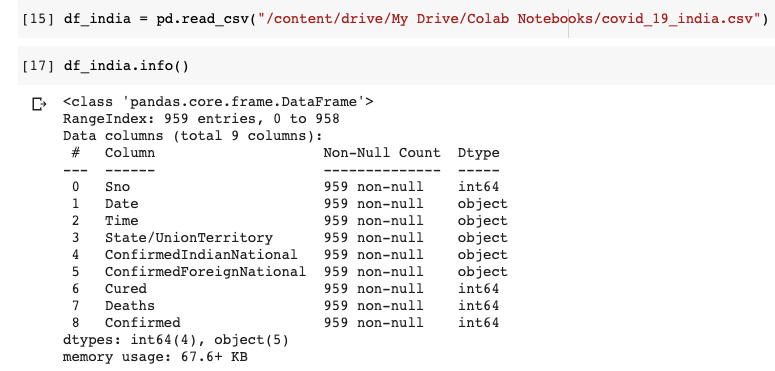
Kaggle에서 가져온 CSV 파일을로드하고 이에 대해 자세히 알아 보겠습니다.
데이터 세트에 총 9 개의 열이 있음을 이해할 수 있습니다. 날짜 및 시간 열은 마지막으로 업데이트 된 날짜 및 시간을 나타냅니다. ConfirmedIndianNational 및 ConfirmedForeignNational 열은 사용하지 않습니다. 따라서이 두 개의 열을 삭제하겠습니다. 시간 열도 중요하지 않습니다. 우리도 그것을 떨어 뜨리 자. 데이터 프레임에 이미 인덱스가 있으므로 Serial No (Sno) 열도 필요하지 않습니다.
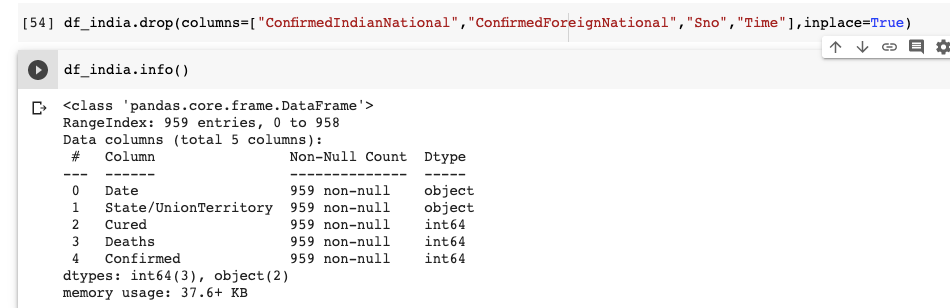
바로 데이터 프레임에 5 개의 열만 있음을 알 수 있습니다. 중복 데이터를 유지하면 불필요한 공간을 차지하고 잠재적으로 런타임이 저하 될 수 있으므로 중복 데이터를 삭제하는 것이 좋습니다.
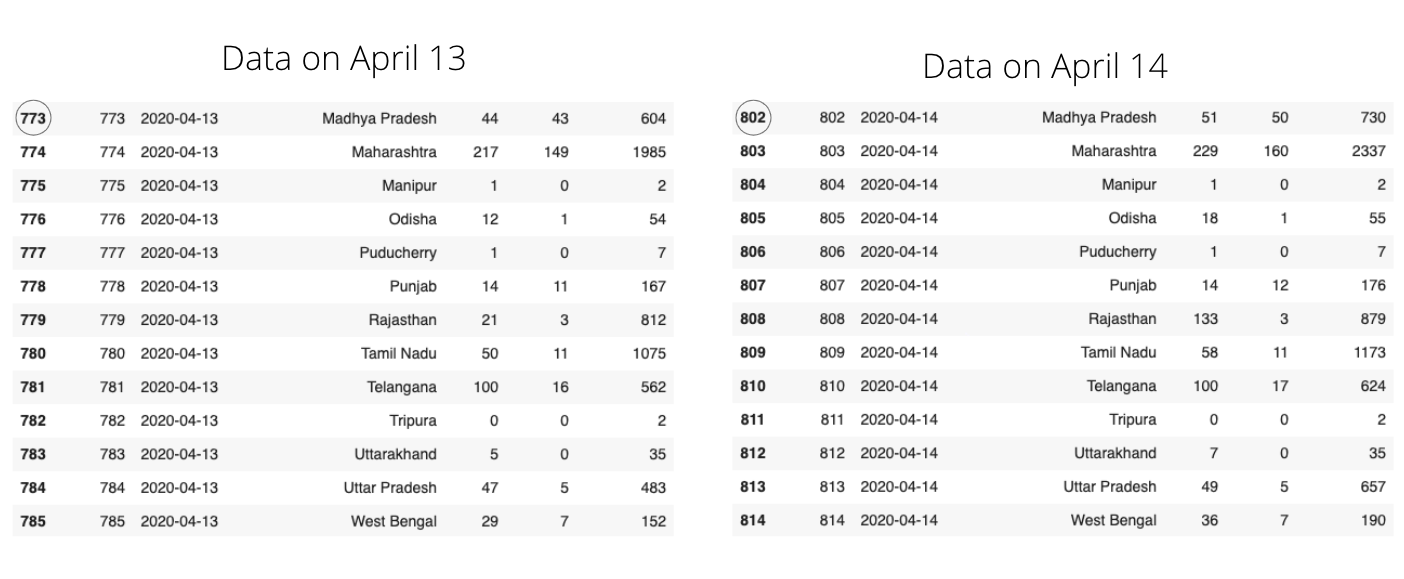
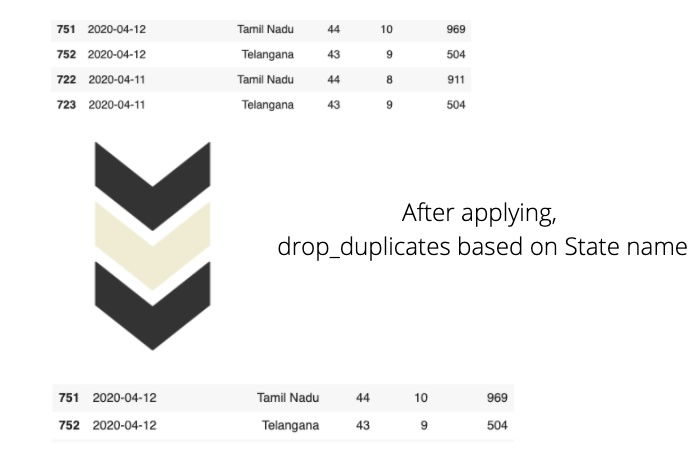
여기에서 Kaggle 데이터 세트는 매일 업데이트됩니다. 기존 데이터를 덮어 쓰는 대신 새 데이터가 추가됩니다. 예를 들어 4 월 13 일 데이터 세트에는 특정주의 누적 데이터를 나타내는 각 행이있는 925 개의 행이 있습니다. 그러나 4 월 14 일에 데이터 세트에 958 개의 행이 있었으며 이는 34 개의 새 행 (데이터 세트에 총 34 개의 상태가 있으므로)이 4 월 14 일에 추가되었음을 의미합니다.
위의 그림에서 동일한 State 이름을 볼 수 있지만 다른 열의 변경 사항을 관찰하십시오. 새로운 사례에 대한 데이터는 매일 데이터 세트에 추가됩니다. 이러한 형태의 데이터는 스프레드 추세를 파악하는 데 유용 할 수 있습니다. 처럼-
시간 경과에 따른 케이스 수의 증가입니다.
시계열 분석 수행
그러나 우리는 이전 데이터를 제외하고 최신 데이터 만 분석하는 데 관심이 있습니다. 따라서 필요하지 않은 행을 삭제하겠습니다.
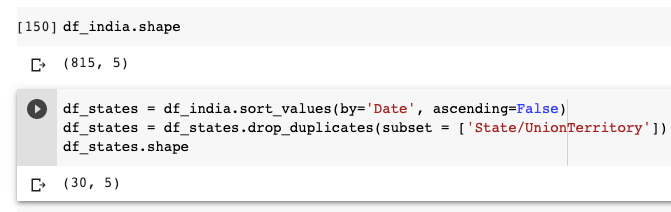
먼저 데이터를 날짜별로 내림차순으로 정렬하겠습니다. 상태 이름을 사용하여 데이터를 그룹화하여 중복 값을 제거하십시오.
df_states 데이터 프레임에 30 개의 행만 있다는 것을 알 수 있습니다. 이는 각 상태에 대한 최신 통계를 보여주는 고유 한 행이 있음을 의미합니다. 날짜 열을 사용하여 데이터 프레임을 정렬 할 때 데이터 프레임을 날짜별로 내림차순으로 정렬하고 (코드에서 ascending = False 확인) remove_duplicates는 값의 첫 번째 항목을 저장하고 모든 중복 항목을 제거합니다.
이제 데이터 시각화에 대해 이야기하겠습니다. Plotly를 사용하여 위의 데이터 프레임을 시각화합니다.
히스토그램, 막대 그래프, 산점도는 패턴과 추세를 효율적으로 설명하지만 지리 데이터를 다루기 때문에 등치 맵을 선호합니다.
등치 맵은 무엇입니까?
Plotly에 따르면 Choropleth 맵은 데이터 변수와 관련하여 색상이 지정되거나 음영 처리 된 분할 된 지리적 영역을 나타냅니다. 이러한지도는 지리적 영역에 대한 가치를 빠르고 쉽게 표시 할 수있는 방법을 제공하며 트렌드와 패턴도 공개합니다.
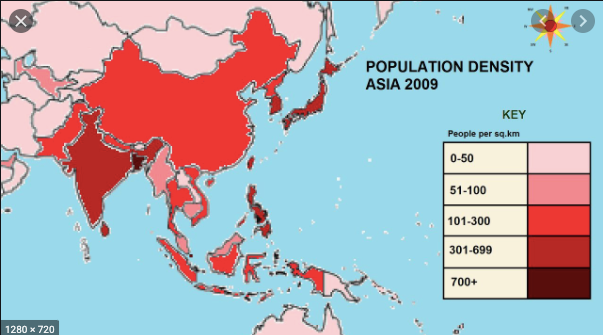
출처 — Youtube
위 이미지에서 영역은 인구 밀도에 따라 색상이 지정됩니다. 색이 어두울수록 특정 지역의 인구가 더 많다는 것을 의미합니다. 이제 데이터 세트와 관련하여 확인 된 사례를 기반으로 등치 맵을 생성 할 것입니다. 확진 자 수가 많을수록 특정 부위의 색이 어두워집니다.
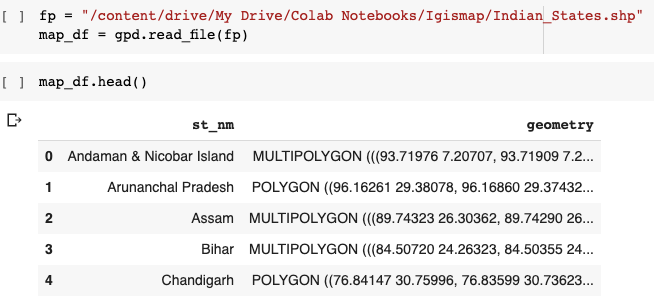
인도지도를 렌더링하려면 상태 좌표가있는 shapefile이 필요합니다. 인도 용 shapefile을 다운로드 할 수 있습니다.여기.
Wikipedia에 따르면shapefile형식은 지리 정보 시스템 (GIS)을위한 지리 공간 벡터 데이터 형식입니다.
shapefile로 작업하기 전에 GeoPandas를 설치해야합니다. GeoPandas는 지리 공간 데이터 작업을 쉽게 만들어주는 Python 패키지입니다.
pip install geopandas
import geopandas as gpd
데이터 프레임에 상태 이름과 벡터 형식의 좌표가 있음을 알 수 있습니다. 이제이 shapefile을 필요한JSON체재.
import json#Read data to json.merged_json = json.loads(map_df.to_json())
다음으로 Plotly Express를 사용하여 등치 맵을 만들 것입니다. 'px.choropleth함수. 등치 맵을 만들려면 기하학적 정보가 필요합니다.
이것은 GeoJSON 형식 (위에서 생성 한)으로 제공 될 수 있으며 각 기능에는 고유 한 식별 값이 있습니다 (예 : st_nm)
2. 미국 주 및 세계 국가를 포함하는 Plotly 내의 기존 도형
GeoJSON 데이터, 즉 (위에서 만든 merged_json)은Geojson인수 및 측정 메트릭이색깔인수px.choropleth.
모든 등치 맵에는위치주 / 국가를 매개 변수로 사용하는 인수입니다. 인도의 여러 주에 대한 등치 맵을 만들고 있으므로 State 열을 인수에 전달합니다.
첫 번째 매개 변수는 데이터 프레임 자체이며 확인 된 값에 따라 색상이 달라집니다. 우리는명백한인수fig.updtae_geos ()기본지도와 프레임을 숨기려면 False로 설정합니다. 우리는 또한 설정fitbounds = "위치"세계지도를 자동으로 확대하여 관심 영역을 표시합니다.
Let us imagine you are trying to convince a client to invest in your company. You exhibit all the employee’s records and their achievements in the form of an excel sheet rather than a bar chart or a pie chart. Imagine yourself in the client’s place. How would you react then? (Wouldn’t too much data be so overwhelming?). This is where data visualization comes into the picture.
Data visualization is the practice of translating raw data into visual plots and graphs to make it easier for the human brain to interpret. The primary objective is to make the research and data analysis quicker and also to communicate the trends, patterns effectively.
The human brain is programmed to understand visually appealing data better than lengthy plain texts.
In this article, Let us take a dataset, clean the data as per requirement, and try visualizing the data. The dataset is taken from Kaggle. You can find it here.
Firstly, to load the data from external sources and clean it, we will be using the Pandas library. You can study more about Pandas in my previous article here.
We need to import the Pandas library in-order to use it. We can import it by using it.
import pandas as pd
Let us load the CSV file taken from Kaggle and try to know more about it.
We can understand that the dataset has 9 columns in total. The Date and Time column indicate the last updated date and time. We are not going to use the ConfirmedIndianNational and ConfirmedForeignNational columns. Hence let us drop these 2 columns. The Time column is also immaterial. Let us drop it too. Since the Data Frame already has an index, the Serial No(Sno) column is also not required.
Right away, we can see that the data frame has only 5 columns. It is a good practice to drop redundant data because retaining it will take up unneeded space and potentially bog down runtime.
Here the Kaggle dataset is updated daily. New data is appended instead of overwriting the existing data. For instance, on April 13th dataset has 925 rows with each row representing the cumulative data of one particular state. But on April 14th, the dataset had 958 rows, which means 34 new rows(Since there are a total of 34 different states in the dataset) were appended on April 14th.
In the above picture, you can notice the same State names, but try to observe the changes in other columns. Data about new cases are appended to the dataset every day. This form of data can be useful to know the spread trends. Like-
The increment in the number of cases across time.
Performing time series analysis
But we are interested in analyzing only the latest data leaving aside the previous data. Hence let us drop those rows which are not required.
Firstly, let us sort the data by date in descending order. And get rid of the duplicate values by grouping data using state name.
You can see that the df_states data frame has only 30 rows, which means there is a unique row showing the latest stats for each state. When we sort the data frame using the date column, we will have data frame sorted according to dates in descending order(observe that ascending=False in code) and remove_duplicates stores the first occurrence of value and removes all its duplicate occurrences.
Let us now talk about data visualization. We will use Plotly to visualize the above data frame.
Histograms, Barplots, Scatter plots explain patterns and trends efficiently, but since we are dealing with geographical data, I prefer choropleth maps.
What are Choropleth maps?
According to Plotly, Choropleth maps depict divided geographical regions that are colored or shaded with respect to a data variable. These maps offer a quick and easy way to show value over a geographical area, unveiling trends and patterns too.
Source — Youtube
In the above image, areas are colored based on their population density. Darker the color implies higher the population in that particular area. Now with respect to our dataset, we are also going to create a choropleth map based on Confirmed cases. More the number of confirmed cases, darker the color of that particular region.
To render an Indian map, we need a shapefile with the state coordinates. We can download the shapefile for India here.
According to Wikipedia, The shapefile format is a geospatial vector data format for geographic information system (GIS).
Before working with shapefiles, we need to install GeoPandas, which is a python package that makes work with geospatial data easy.
pip install geopandas
import geopandas as gpd
You can see that the data frame has a State name and its coordinates in vector form. Now we will convert this shapefile into the required JSON format.
import json#Read data to json.merged_json = json.loads(map_df.to_json())
Next, we are going to create Choropleth Maps using Plotly Express.’ px.choropleth function. Making choropleth maps requires geometric information.
This can either be a supplied in the GeoJSON format(which we created above) where each feature has a unique identifying value (like st_nm in our case)
2. Existing geometries within Plotly that include the US states and world countries
The GeoJSON data, i.e. (the merged_json we create above) is passed to the geojson argument and the metric of measurement is passed into the color argument of px.choropleth.
Every choropleth map has a locations argument that takes the State/Country as a parameter. Since we are creating a choropleth map for different states in India, we pass the State column to the argument.
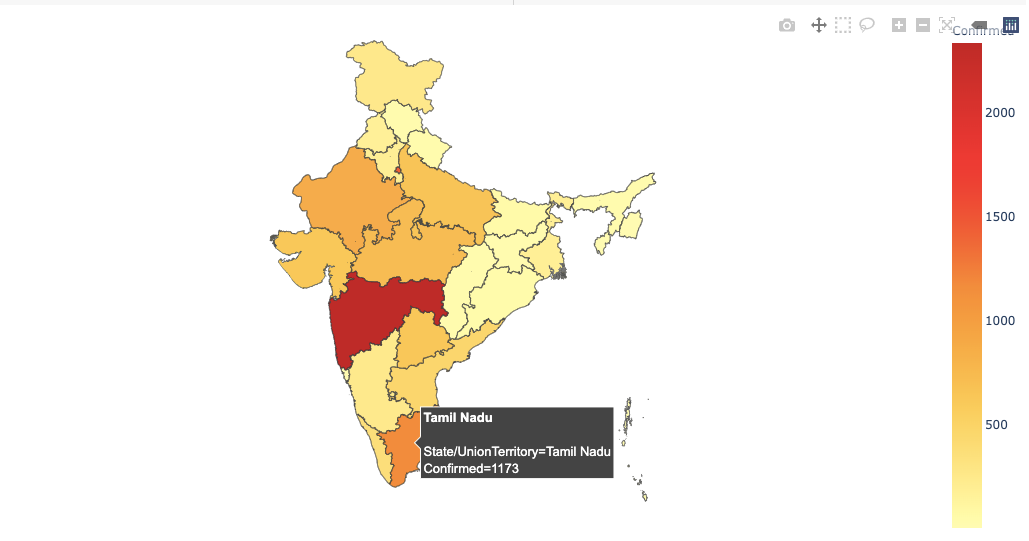
The first parameter is the data frame itself, and the color is going to vary based on the Confirmed value. We set the visible argument in fig.updtae_geos() to False to hide the base map and frame. We also set fitbounds = "locations" to automatically zoom the world map to show our areas of interest.
We can hover across states to know more about them.
Data Visualization is an art that is highly underestimated. Hopefully, you have taken some concepts that will help when visualizing data in real-time. Do feel free to share your feedback and responses. Raise your hands if you’ve learned something new today.