Data Mining, Data Science
Extracting Data from PDF File Using Python and R
Demonstration of parsing PDF files using Python & R API

Data is key for any analysis in data science, be it inferential analysis, predictive analysis, or prescriptive analysis. The predictive power of a model depends on the quality of the data that was used in building the model. Data comes in different forms such as text, table, image, voice or video. Most often, data that is used for analysis has to be mined, processed and transformed to render it to a form suitable for further analysis.
The most common type of dataset used in most of the analysis is clean data that is stored in a comma-separated value (csv) table. However because a portable document format (pdf) file is one of the most used file formats, every data scientist should understand how to extract data from a pdf file and transform the data into a format such as “csv” that can then be used for analysis or model building.
Copying data from a pdf file line by line is too tedious and can often lead to corruption due to human errors during the process. It is therefore extremely important to understand how to import data from a pdf in an efficient and error-free manner.
In this article, we shall focus on extracting a data table from a pdf file. A similar analysis can be made for extracting other types of data such as text or an image from a pdf file. This article focuses on extracting numerical data from a pdf file. For extraction of images from a pdf file, python has a package called minecart that can be used for extracting images, text, and shapes from pdfs.
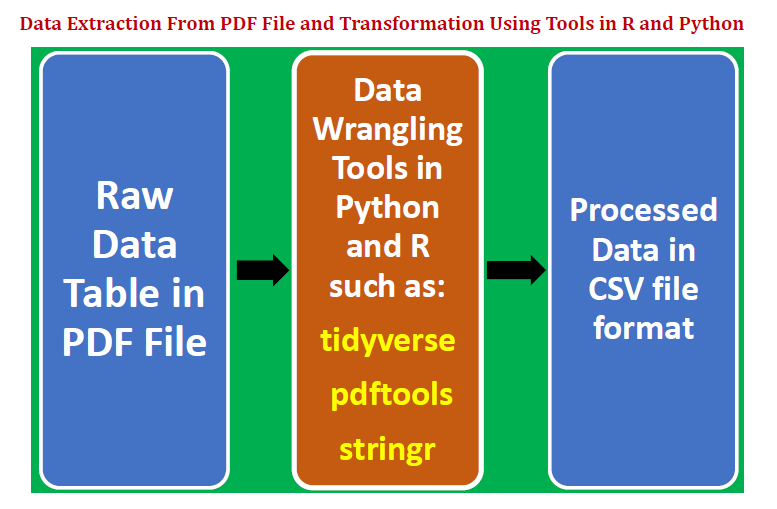
We illustrate how a data table can be extracted from a pdf file and then transformed into a format appropriate for further analysis and model building. We shall present two examples, one using Python, and the other using R. This article will consider the following:
- Extract a data table from a pdf file.
- Clean, transform and structure the data using data wrangling and string processing techniques.
- Store clean and tidy data table as a csv file.
- Introduce data wrangling and string processing packages in R such as “tidyverse”, “pdftools”, and “stringr”.
Example 1: Extract a Table from PDF File Using Python
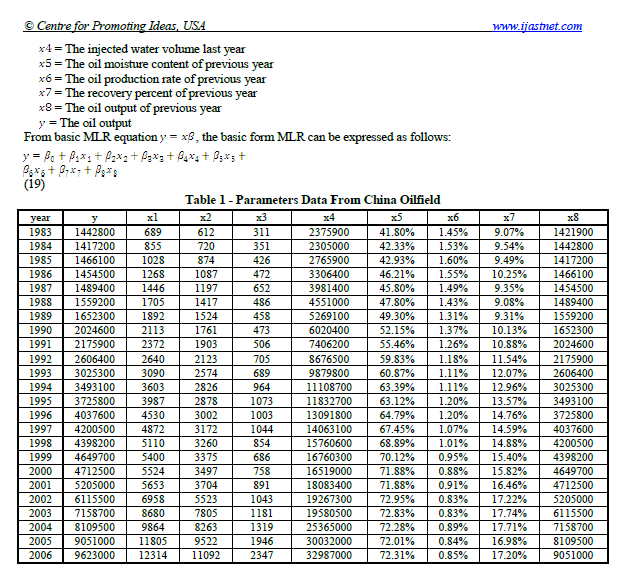
Let us suppose we would like to extract the table below from a pdf file.
— — — — — — — — — — — — — — — — — — — — — — — — —

— — — — — — — — — — — — — — — — — — — — — — — — —
a) Copy and past table to Excel and save the file as table_1_raw.csv
Data is stored in one-dimensional format and has to be reshaped, cleaned, and transformed.
b) Import necessary libraries
import pandas as pd
import numpy as np
c) Import raw data and reshape the data
df=pd.read_csv("table_1_raw.csv", header=None)df.values.shapedf2=pd.DataFrame(df.values.reshape(25,10))column_names=df2[0:1].values[0]df3=df2[1:]df3.columns = df2[0:1].values[0]df3.head()

d) Perform data wrangling using string processing tools
We notice from the table above that columns x5, x6, and x7 are expressed in percentages, so we need to get rid of the percent (%) symbol:
df4['x5']=list(map(lambda x: x[:-1], df4['x5'].values))df4['x6']=list(map(lambda x: x[:-1], df4['x6'].values))df4['x7']=list(map(lambda x: x[:-1], df4['x7'].values))
e) Convert data to numeric form
We note that column values for columns x5, x6, and x7 have data types of string, so we need to convert these to numeric data as follows:
df4['x5']=[float(x) for x in df4['x5'].values]df4['x6']=[float(x) for x in df4['x6'].values]df4['x7']=[float(x) for x in df4['x7'].values]
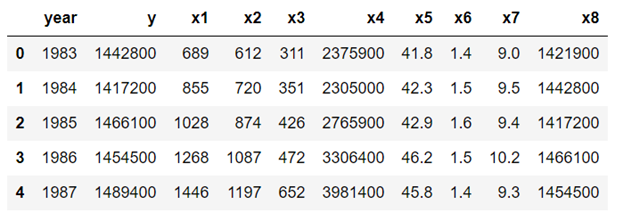
f) View final form of the transformed data
df4.head(n=5)
g) Export final data to a csv file
df4.to_csv('table_1_final.csv',index=False)Example 2: Extract a Table From PDF File Using R
This example illustrates how to extract a table from a pdf file using data wrangling techniques in R. Let us suppose we have the following table from a pdf file name trade_report.pdf:
— — — — — — — — — — — — — — — — — — — — — — — — —
— — — — — — — — — — — — — — — — — — — — — — — —
We would like to extract the table, wrangle the data, and convert it to a data frame table ready for further analysis. The final data table can then be easily exported and stored in a “csv” file. In particular, we would like to accomplish the following:
i) On the column Product, we would like to get rid of USD from the product ETC-USD.
ii) Split the Date column into two separate columns, namely, date and time.
iii) Remove USD from columns Fee and Total.
The dataset and code for this example can be downloaded from this repository: https://github.com/bot13956/extract_table_from_pdf_file_using_R.
a) Import necessary libraries
library("tidyverse")library("stringr")library("pdftools")
b) Extract table and convert into the text file
# define file pathpdf_file <- file.path("C:\\Users\\btayo\\Desktop\\TRADE", "trade_report.pdf")# convert pdf file to text (txt) filetext <- pdf_text(pdf_file)
c) Wrangle the data to clean and organize it using string processing tools
tab <- str_split(text, "\n")[[1]][6:31]tab[1] <- tab[1]%>%str_replace("\\.","")
                %>%str_replace("\r","")col_names <- str_replace_all(tab[1],"\\s+"," ")
             %>%str_replace(" ", "")
             %>%str_split(" ")
             %>%unlist()col_names <- col_names[-3]col_names[2] <- "Trade_id"col_names <- append(col_names, "Time", 5)col_names <- append(col_names,"sign",9)length(col_names)==11tab <- tab[-1]dat <- data.frame(
               x=tab%>%str_replace_all("\\s+"," ")
                    %>%str_replace_all("\\s*USD","")
                    %>%str_replace(" ",""),stringsAsFactors = FALSE)data <- dat%>%separate(x,col_names,sep=" ")data<-data%>%mutate(total=paste(data$sign,data$Total,sep=""))
          %>%select(-c(sign,Total))names(data)<- names(data)%>%tolower()data$product <- data$product%>%str_replace("-$","")
d) View final form of the transformed data
data%>%head()
The dataset and code, for Example 2 can be downloaded from this repository: https://github.com/bot13956/extract_table_from_pdf_file_using_R.
In summary, we’ve shown how a data table can be extracted from a pdf file. Since a pdf file is a very common file type, every data scientist should be familiar with techniques for extracting and transforming data stored in a pdf file.
'Data Analytics(en)' 카테고리의 다른 글
| No More Basic Plots Please (0) | 2020.10.05 |
|---|---|
| The Definitive Data Scientist Environment Setup (0) | 2020.10.03 |
| Advanced Python: Itertools Library — The Gem Of Python Language (0) | 2020.10.01 |
| Data Visualisation using Pandas and Plotly (0) | 2020.09.30 |
| Bye-bye Python. Hello Julia! (0) | 2020.09.29 |