Interactive spreadsheets in Jupyter
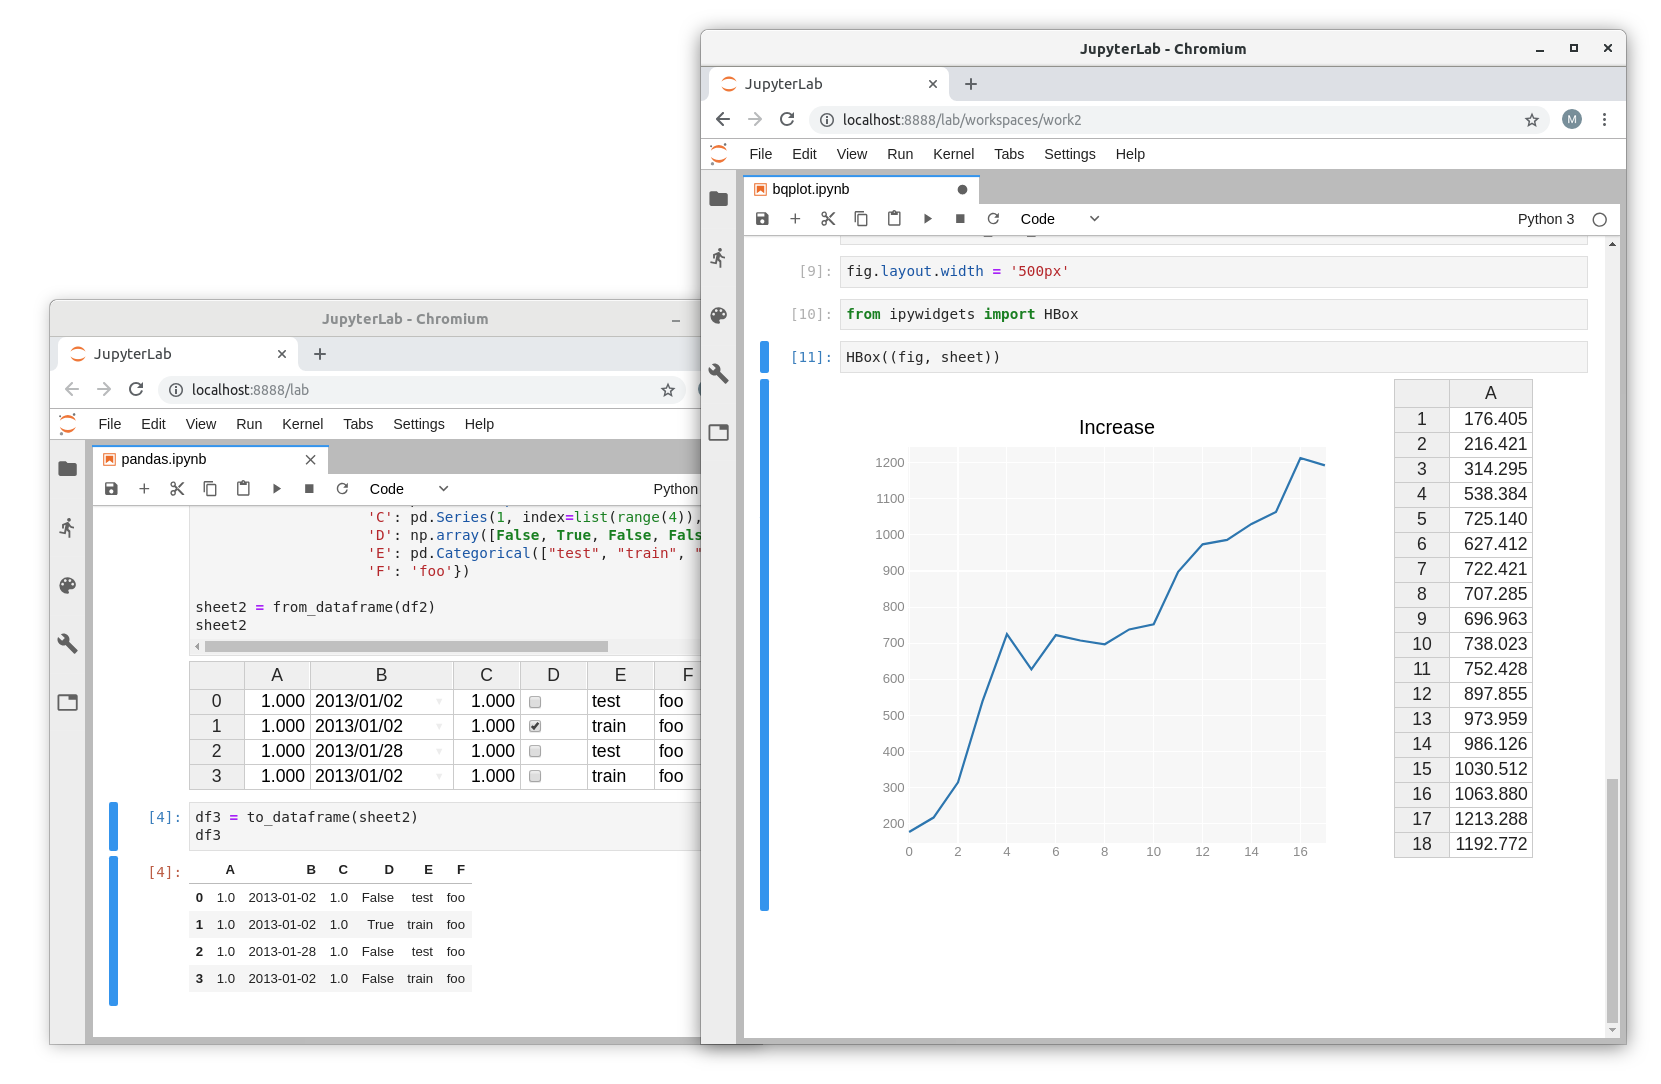
ipywidgets plays an essential part in the Jupyter ecosystem; it brings interactivity between user and data.
Widgets are eventful Python objects that often have a visual representation in the Jupyter Notebook or JupyterLab: a button, a slider, a text input, a checkbox…
More than a library of interactive widgets, ipywidgets is a powerful framework upon which it is straightforward to create new custom widgets. Developers can quickly start their own widgets library with best practices of code structure and packaging using the widget-cookiecutter project.
You can find examples of really nice widgets libraries in the blog-post: Video streaming in the Jupyter Notebook.
A spreadsheet is an interactive tool for data analysis in a tabular form. It consists of cells and cell ranges. It supports value dependent cell formatting/styling and one can apply mathematical functions on cells and perform chained computations. It is the perfect user interface for statistical and financial operations.
The Jupyter Notebook was lacking a spreadsheet library, that’s when ipysheet comes into play.
ipysheet
ipysheet is a new interactive widgets library that aims at implementing the core features of a good spreadsheet application and more.
There are two main widgets in ipysheet, the Cell widget, and the Sheet widget. We provide helper functions for creating rows, columns and cell ranges in general.
The cell value can be a boolean, a numerical value, a string, a date, and of course another widget!
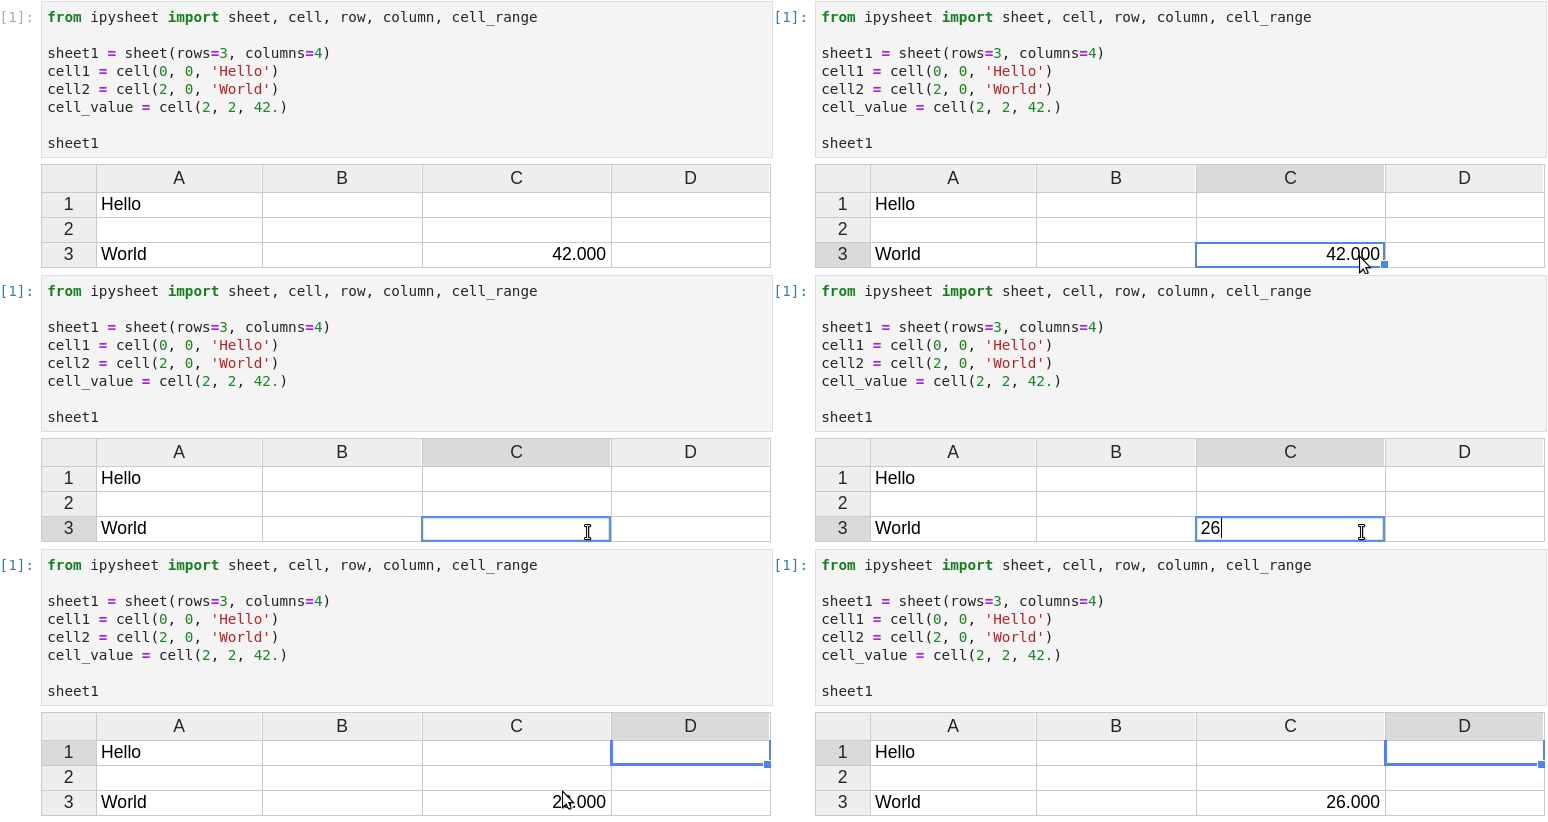
ipysheet uses a Matplotlib-like API for creating a sheet:
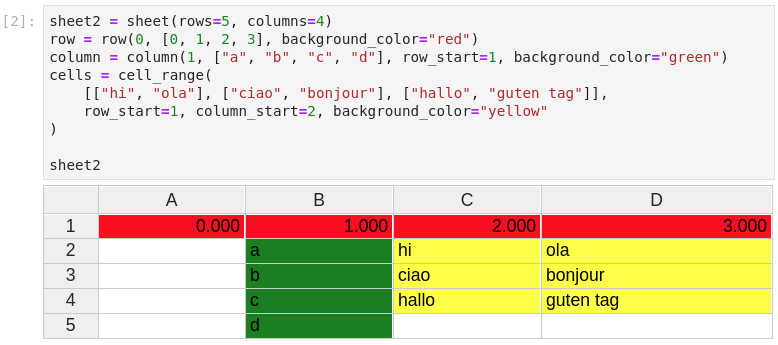
The user can create entire rows, columns, and even cell ranges:
Of course, values in cells are dynamic, the cell value can be dynamically updated from Python and the new value will be visible in the sheet.
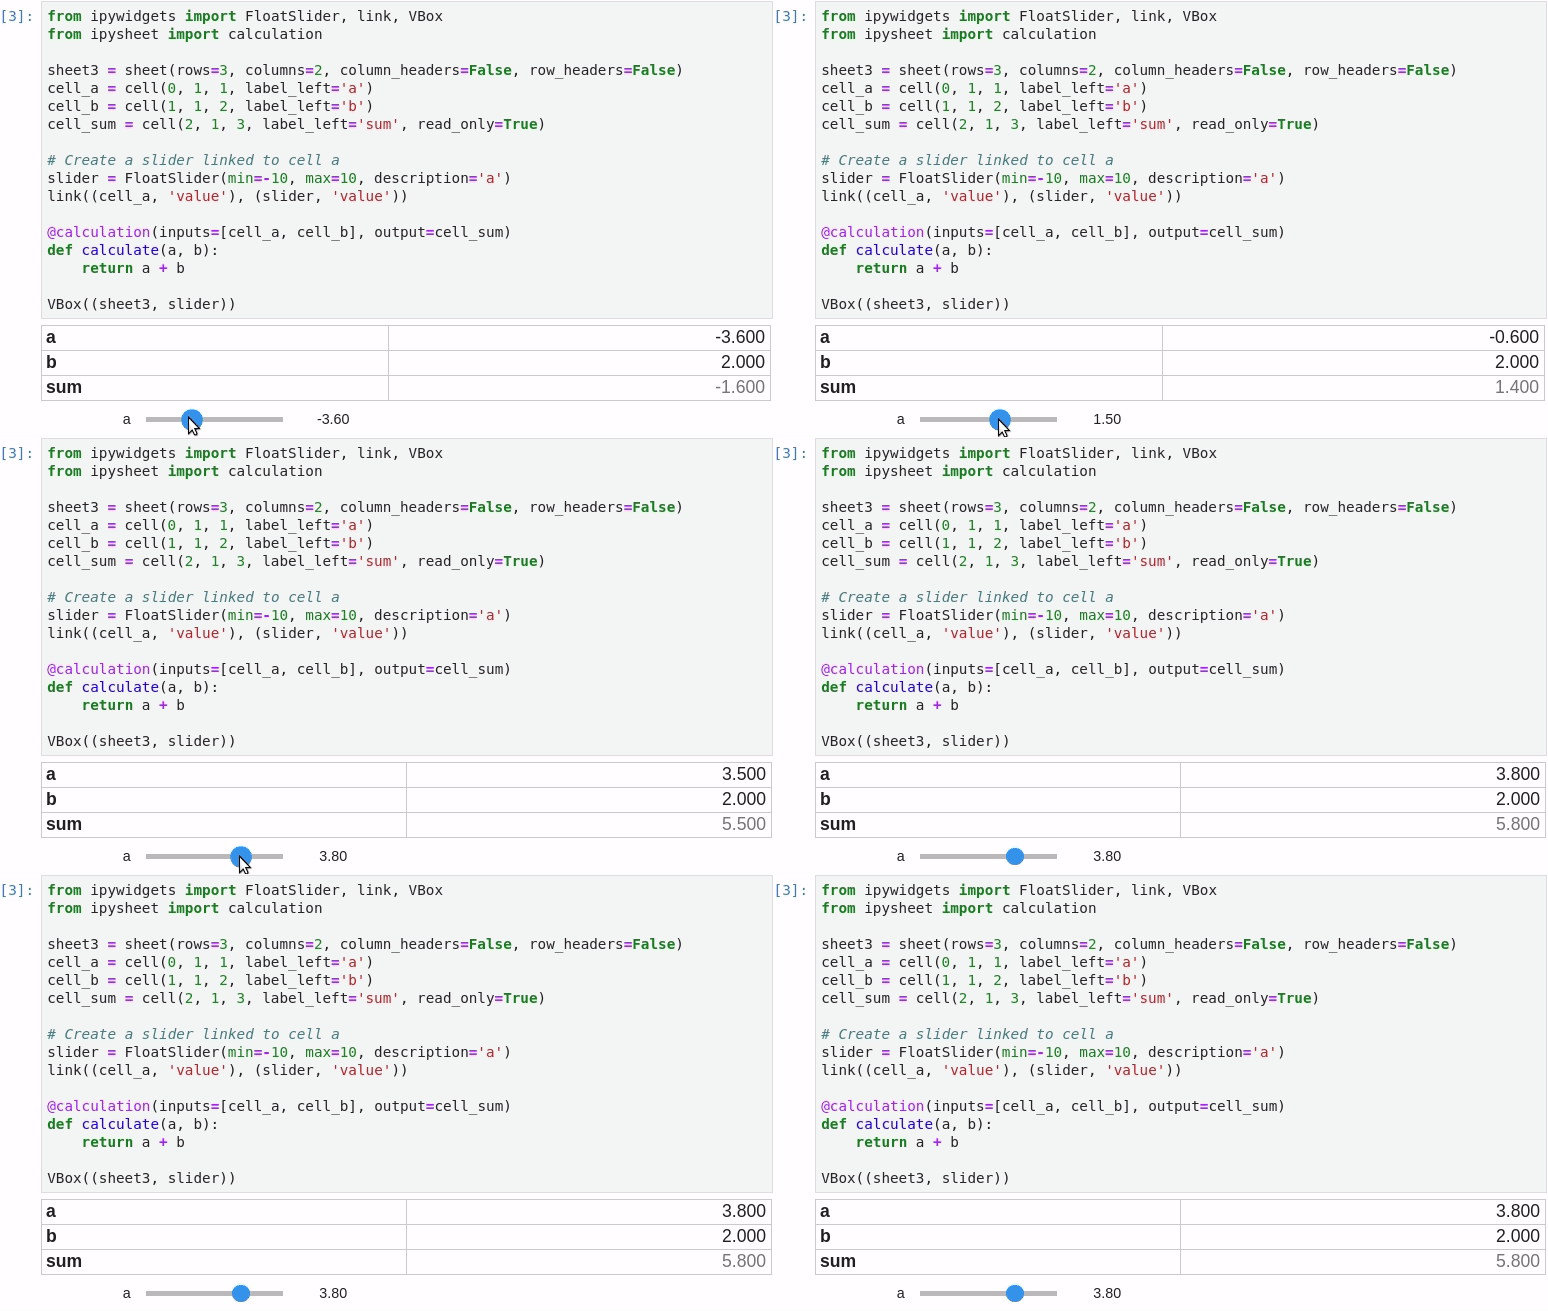
It is possible to link a cell value to a widget (in the following screenshot a FloatSlider widget is linked to cell “a”) and to define a specific cell as the result of a custom calculation depending on other cells:
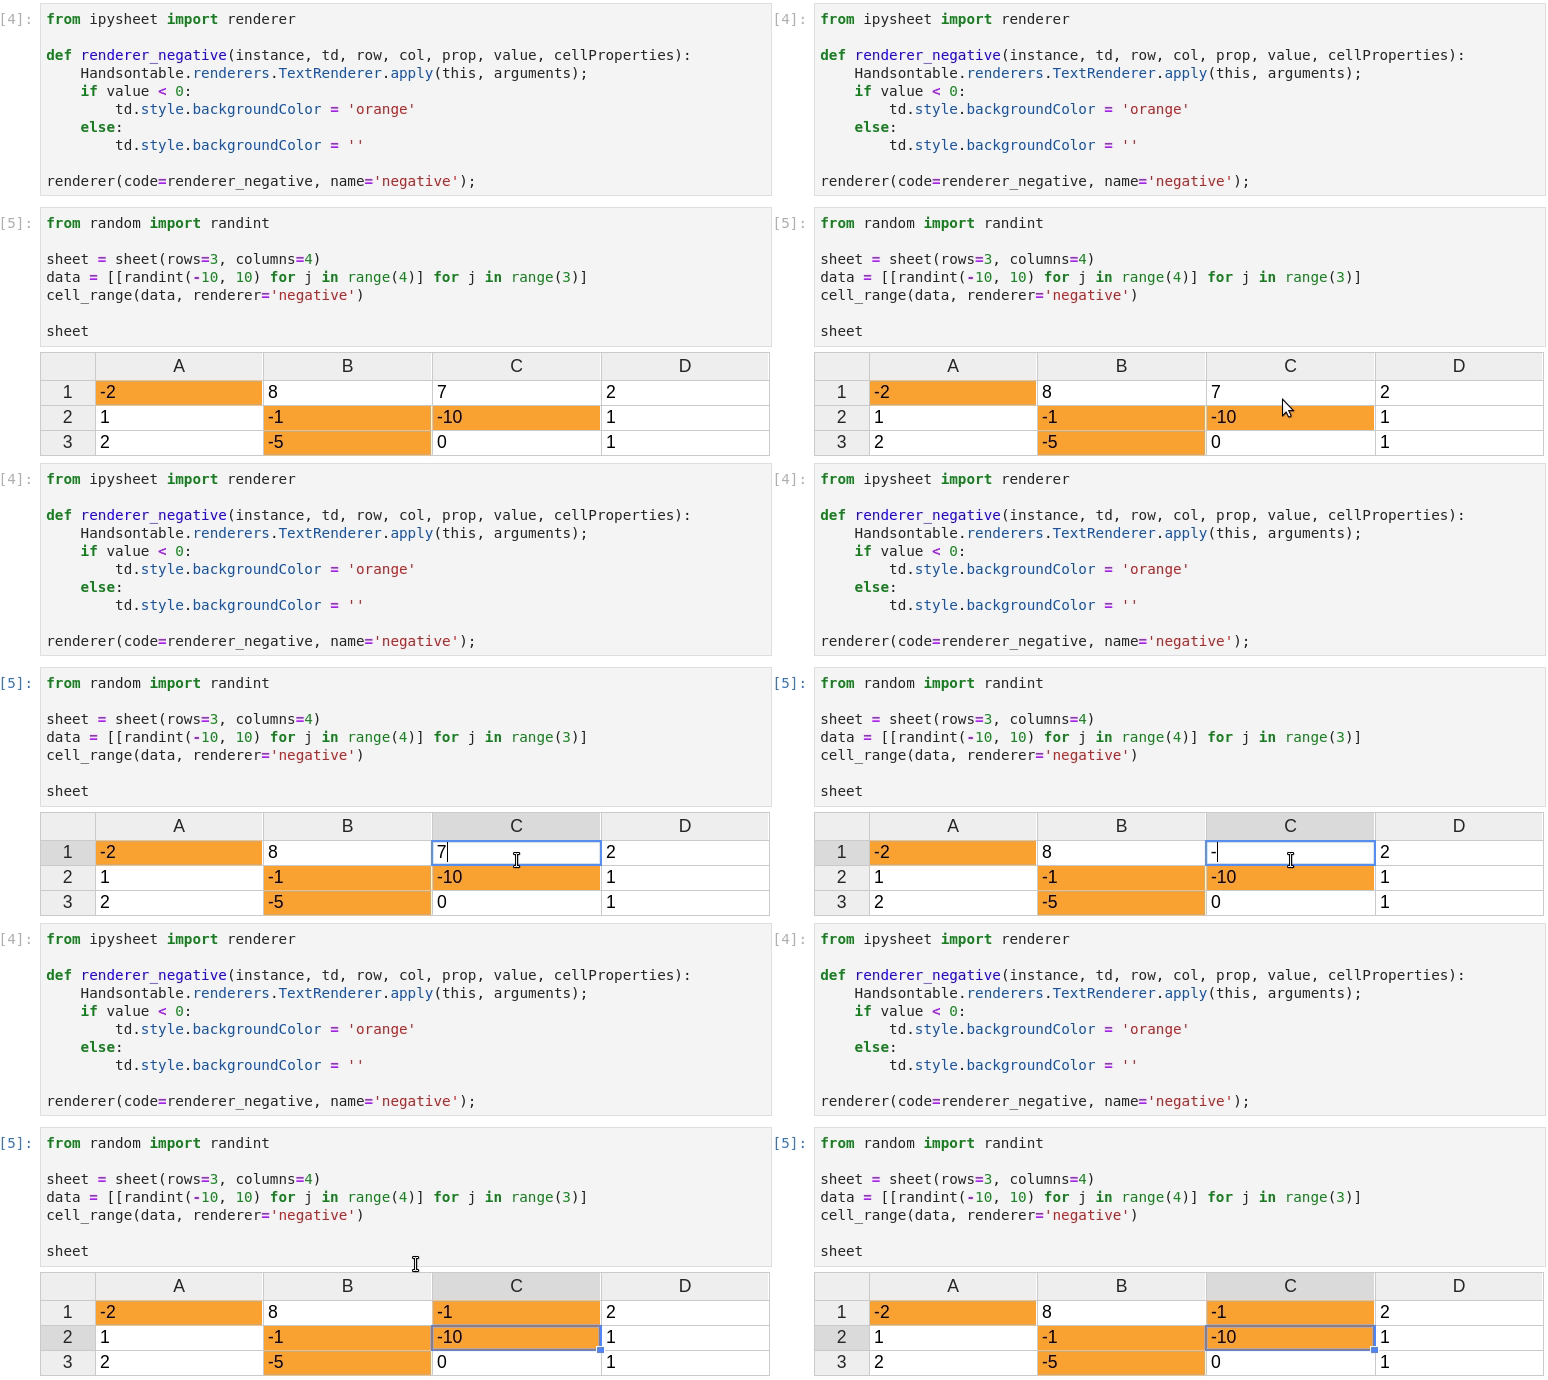
Custom styling can be used, using what we call renderers:
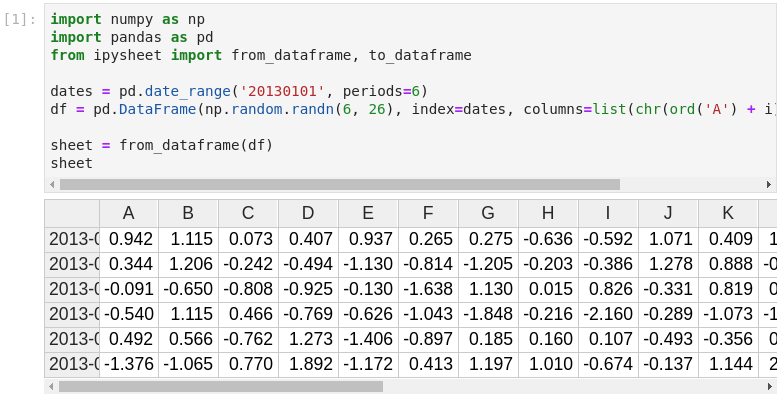
Adding support to NumPy Arrays and Pandas Dataframes loading and exporting was an important feature that we wanted. ipysheet provides from_array, to_array, from_dataframe and to_dataframe functions for this purpose:
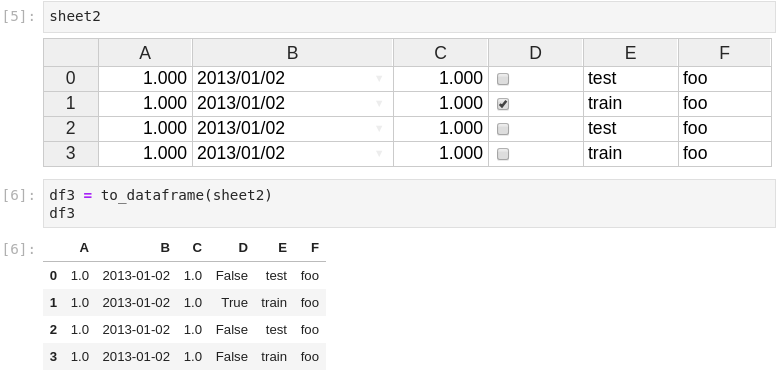
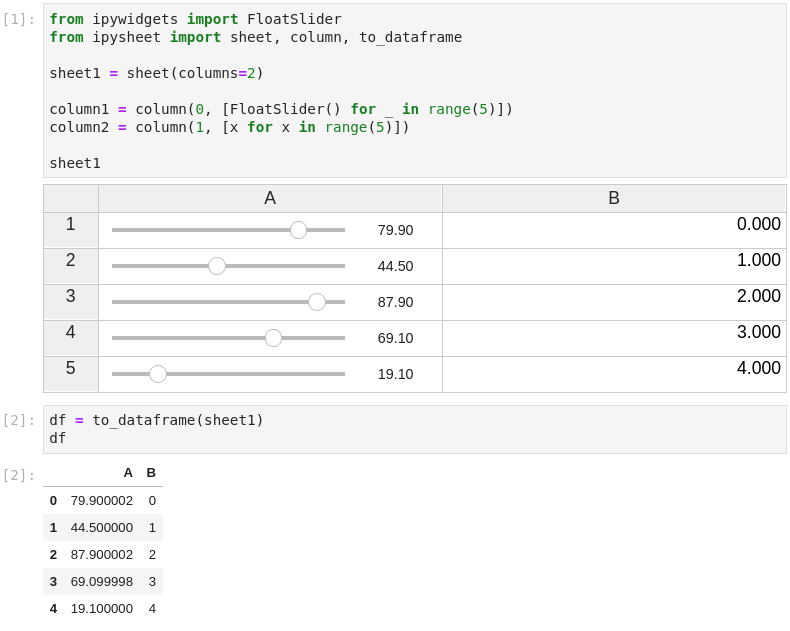
Another killer feature is that a cell value can be ANY interactive widget. This means that the user can put a button or a slider widget in a cell:
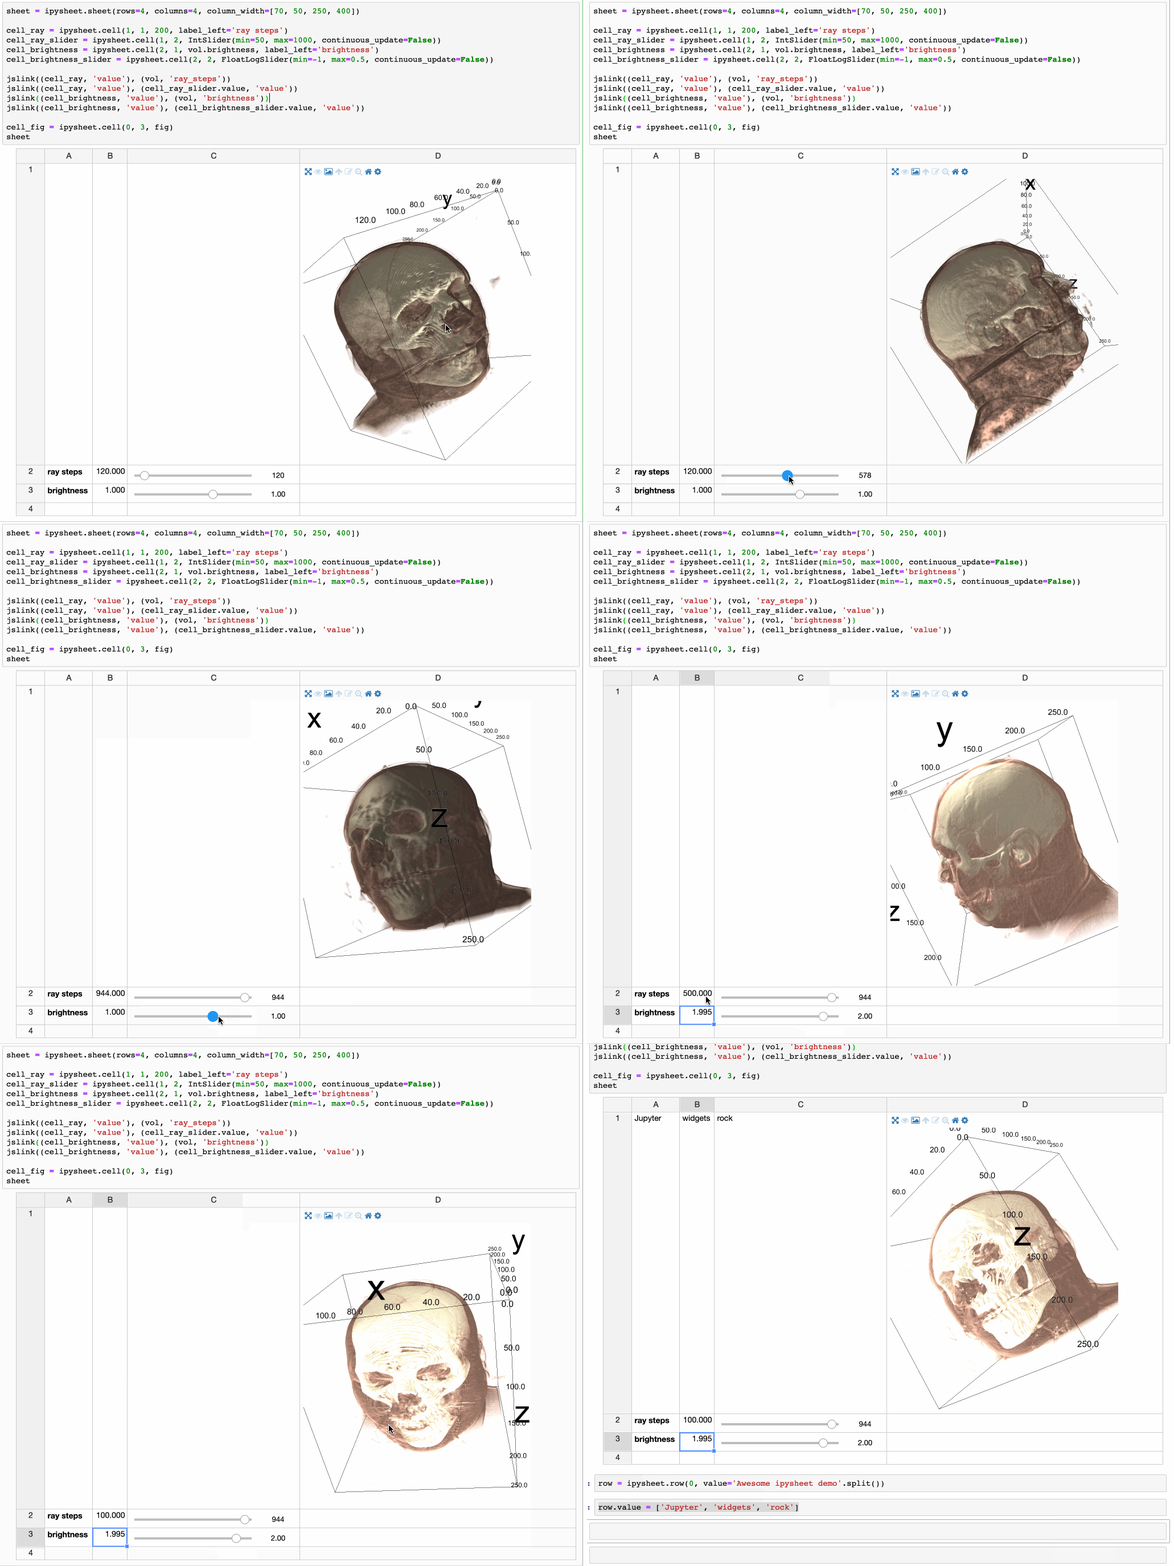
But it also means that a higher level widget can be put in a cell. Whether the widget is a plot from bqplot, a map from ipyleaflet or even a multi-volume rendering from ipyvolume:
You can try it right now with binder, without the need of installing anything on your computer, just by clicking on this button:

The source code is hosted on Github: https://github.com/QuantStack/ipysheet/
Similar projects
- ipyaggrid is a widgets library for importing/editing/exporting Pandas Dataframes: Harnessing the power of ag-Grid in Jupyter
- qgrid is an interactive grid for sorting, filtering, and editing Pandas Dataframes in Jupyter notebooks.
Acknowledgments
The development of ipysheet is led by QuantStack.

This development is sponsored by Société Générale and Bloomberg.
About the Authors
Maarten Breddels is an entrepreneur and freelance developer / consultant / data scientist working mostly with Python, C++ and Javascript in the Jupyter ecosystem. Founder of vaex.io. His expertise ranges from fast numerical computation, API design, to 3d visualization. He has a Bachelor in ICT, a Master and PhD in Astronomy, likes to code and solve problems.
Martin Renou is a Scientific Software Engineer at QuantStack. Before joining QuantStack, he studied at the French Aerospace Engineering School SUPAERO. He also worked at Logilab in Paris and Enthought in Cambridge. As an open source developer at QuantStack, Martin worked on a variety of projects, from xsimd, xtensor, xframe, xeus and xeus-python in C++ to ipyleaflet and ipywebrtc in Python and JavaScript.
'Data Analytics(en)' 카테고리의 다른 글
| Bringing the best out of Jupyter Notebooks for Data Science (0) | 2020.09.28 |
|---|---|
| Please Stop Doing These 5 Things in Pandas (0) | 2020.09.27 |
| Pandas DataFrame (Python): 10 useful tricks (0) | 2020.09.25 |
| Introducing Bamboolib — a GUI for Pandas (0) | 2020.09.25 |
| Jupyter is now a full-fledged IDE (0) | 2020.09.25 |