Introducing Bamboolib — a GUI for Pandas
A couple of days back, mister Tobias Krabel contacted me via LinkedIn to introduce me to his product, a Python library called Bamboolib, which he states to be a GUI tool for learning Pandas — Python’s data analysis and visualization library.
He states, and I quote:
Our goal is to help people quickly learn and work with pandas, and we want to onboard the next generation of python data scientists.
I have to admit, I was skeptical at first, mainly because I’m not a big fan of GUI tools and drag & drop principle in general. Still, I’ve opened the URL and watched the introduction video.
It was one of those rare times when I was legitimately intrigued.
From there I’ve quickly responded to Tobias, and he kindly offered me to test out the library and see if I liked it.
How was it? Well, you’ll have to keep reading to find the answer to that. So let’s get started.
Is it Free?
In a world where such amazing libraries like Numpy and Pandas are free to use, this question may not even pop in your head. However, it should, because not all versions of Bamboolib are free.
If you don’t mind sharing your work with others, then yeah, it’s free to use, but if that poses a problem then it will set you back at least $10 a month which might be a bummer for the average users. Down below is the full pricing list:
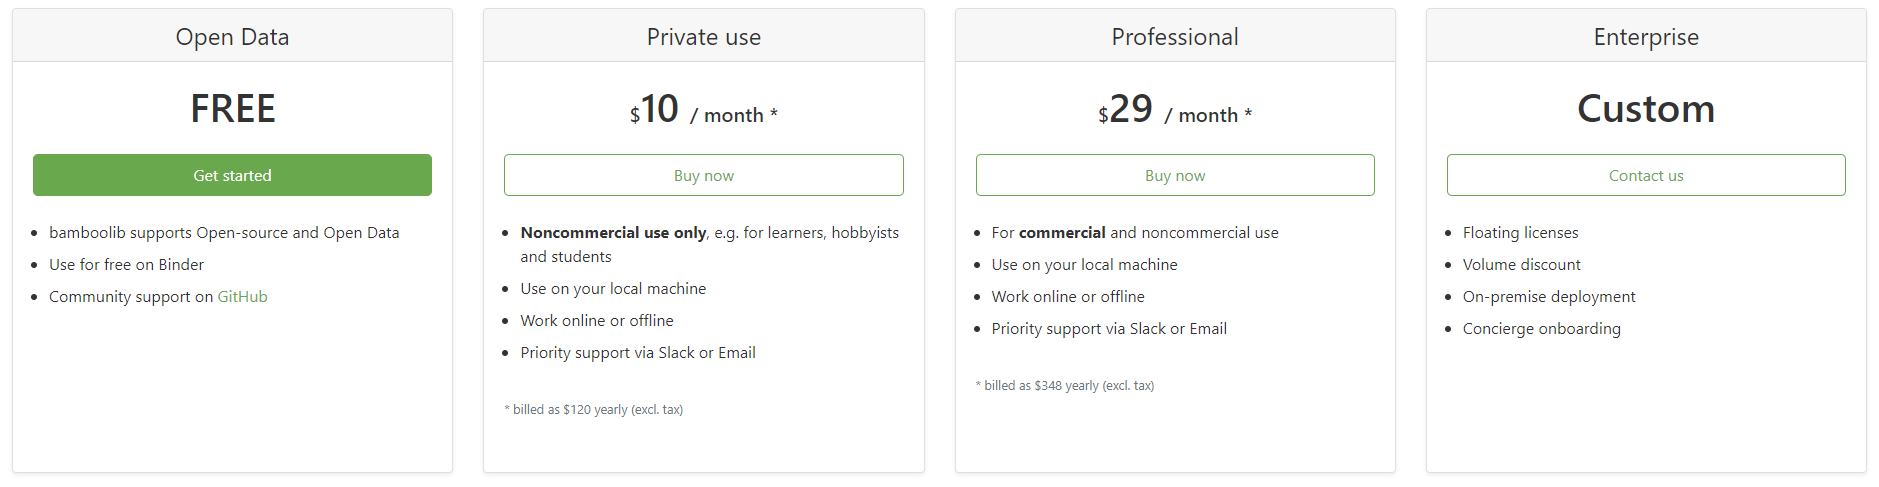
As the developer of the library stated, Bamboolib is designed to help you learn Pandas, so I don’t see a problem with going with the free option — most likely you won’t be working on some top-secret project if just starting out.
This review will, however, be based on the private version of the library, as that’s the one Tobias gave access to me. With that being said, this article is by no means written with the idea of persuading you to buy the license, it only provides my personal opinion.
Before jumping into the good stuff, you’ll need to install the library first.
The Installation Process
The first and most obvious thing to do is pip install:
pip install bamboolibHowever, there’s a lot more to do if you want this thing fully working. It is designed to be a Jupyter Lab extension (or Jupyter Notebook if you still use those), so we’ll need to set up a couple of things there also.
In a command line type the following:
jupyter nbextension enable --py qgrid --sys-prefix
jupyter nbextension enable --py widgetsnbextension --sys-prefix
jupyter nbextension install --py bamboolib --sys-prefix
jupyter nbextension enable --py bamboolib --sys-prefix
Now you’ll need to find the major version of Jupyter Lab installed on your machine. You can obtain it with the following command:
jupyter labextension listMine is “1.0”, but yours can be anything, so here’s a generic version of the next command you’ll need to execute:
jupyter labextension install @jupyter-widgets/jupyterlab-manager@MAJOR_VERSION.MINOR_VERSION --no-buildNote that you need to replace “MAJOR_VERSION.MINOR_VERSION” with the version number, which is “1.0” in my case.
A couple of commands more and you’re ready to rock:
jupyter labextension install @8080labs/qgrid@1.1.1 --no-build
jupyter labextension install plotlywidget --no-build
jupyter labextension install jupyterlab-plotly --no-build
jupyter labextension install bamboolib --no-build

jupyter lab build --minimize=False
That’ it. Now you can start Juypter Lab and we can dive into the good stuff.
The First Use
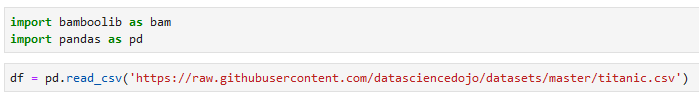
Once in Jupyter, you can import Bamboolib and Pandas, and then use Pandas to load in some dataset:
Here’s how you’d use the library to view the dataset:
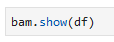
That’s not gonna work the first time you’re using the library. You’ll need to activate it, so make sure to have the license key somewhere near:
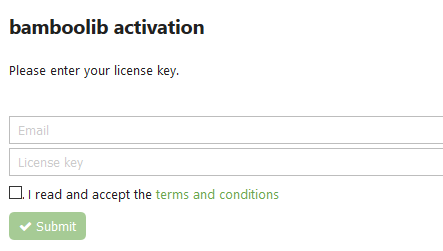
Once you’ve entered the email and license key, you should get the following message indicating that everything went well:
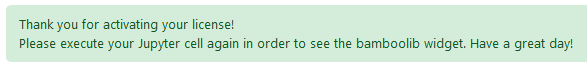
Great, now you can once again execute the previous cell. Immediately you’ll see an unfamiliar, but friendly-looking interface:
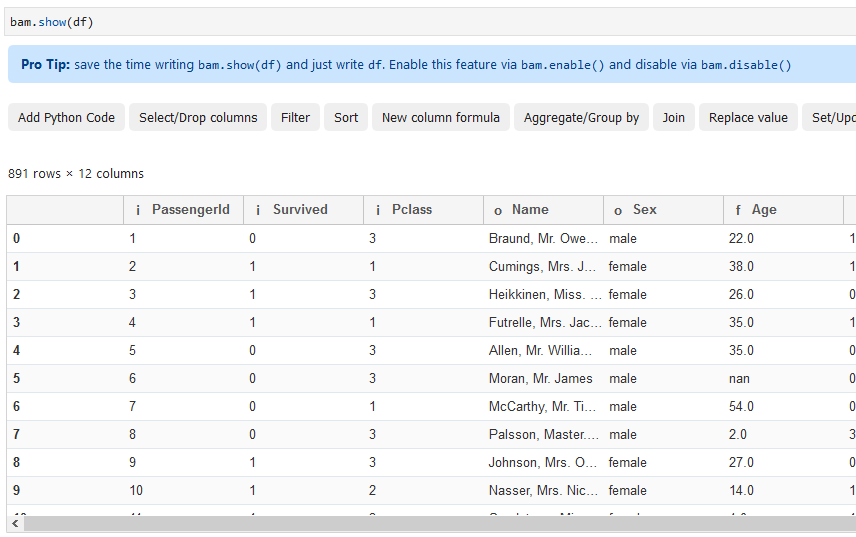
Now everything is good to go, and we can dive into some basic functionalities. It was a lot of work to get to this point, but trust me, it was worth it!
Data Filtering
One of the most common everyday tasks of any data analyst/scientist is data filtering. Basically you want to keep only a subset of data that’s relevant to you in a given moment.
To start filtering with Bamboolib, click on the Filter button.
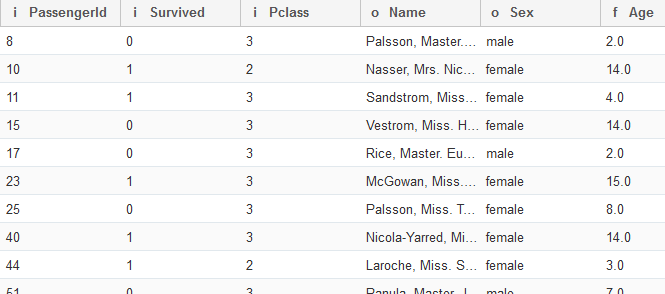
A side menu like the one below should pop up. I’ve decided to filter by the “Age” column, and keep only the rows where the value of “Age” is less than 18:

Once you press Execute, you’ll see the actions took place immediately:
That’s great! But what more can you do?
Replacing Values
Another one of those common everyday tasks is to replace string values with the respective numerical alternative. This dataset is perfect to demonstrate value replacement because we can easily replace string values in the “Sex” column with numeric ones.
To begin, hit the Replace value button and specify the column, the value you want to replace and what you want to replace it with:
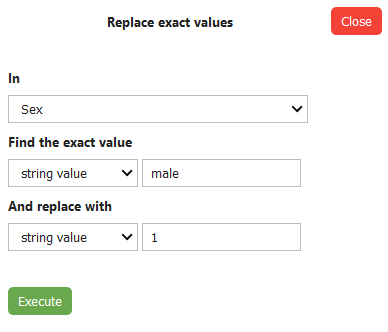
And once the Execute button is hit:
Fantastic! You can do the same for the “female” option, but it’s up to you whether you want to do it or not.
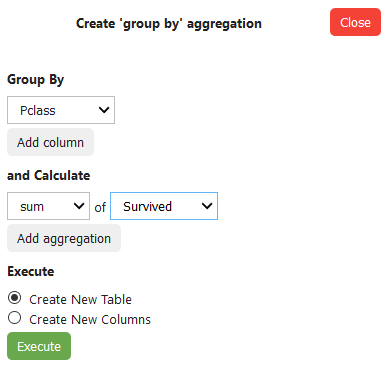
Group By
Yes, you can also perform aggregations! To get started, click on the Aggregate/Group by button and specify what should be done in the side menu.
I’ve decided to group by “Pclass”, because I want to see the total number of survivors per passenger class:
That will yield the following output:

Awesome! Let’s explore one more thing before wrapping up.
One Hot Encoding
Many times when preparing data for machine learning you’ll want to create dummy variables, ergo create a new column per unique value of a given attribute. It’s a good idea to do so because many machine learning algorithms can’t work with text data.
To implement that logic via Bamboolib, hit the OneHotEncoder button. I’ve decided to create dummy variables from the “Embarked” attribute because it has 3 distinct values and you can’t state that one is better than the other. Also, make sure to remove the first dummy to avoid collinearity issues (having variable which is a perfect predictor for some other variable):

Executing will create two new columns in the dataset, just as you would expect:
That’s nice, I’ve done my transformations, but what’s next?
Getting the Code
It was all fun and games until now, but sooner or later you’ll notice the operations don’t act in place — ergo the dataset will not get modified if you don’t explicitly specify it.
That’s not a bug, as it enables you to play around without messing the original dataset. What Bamboolib will do, however, it will generate Python code for achieving the desired transformations.
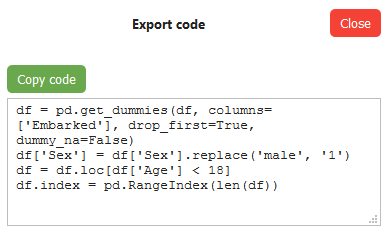
To get the code, first, click on the Export button:

Now specify how do you want it exported — I’ve selected the first option:

And it will finally give you the code which you can copy and apply to the dataset:
Is it worth it?
Until this point, I showcased briefly the main functionalities of Bamboolib — by no means was it exhaustive tutorial — just wanted to show you the idea behind it.
The question remains, is it worth the money?
That is if you decide to go with the paid route. You can still use it for free, provided that you don’t mind sharing your work with others. The library by itself is worth checking out for two main reasons:
- It provides a great way to learn Pandas — it’s much more easy to learn by doing than by reading, and a GUI tool like this will most certainly only help you
- It’s great for playing around with data — let’s face it, there are times when you know what you want to do, but you just don’t know how to implement it in code — Bamboolib can assist
Keep in mind — you won’t get any additional features with the paid version — the only real benefit is that your work will be private and that there’s an option for commercial use.
Even if you’re not ready to grab your credit card just yet, it can’t harm you to try out the free version and see if it’s something you can benefit from.
Thanks for reading. Take care.
'Data Analytics(en)' 카테고리의 다른 글
| Please Stop Doing These 5 Things in Pandas (0) | 2020.09.27 |
|---|---|
| Interactive spreadsheets in Jupyter (0) | 2020.09.26 |
| Pandas DataFrame (Python): 10 useful tricks (0) | 2020.09.25 |
| Jupyter is now a full-fledged IDE (0) | 2020.09.25 |
| Handling exceptions in Python a cleaner way, using Decorators (0) | 2020.09.25 |