Pandas DataFrame (Python): 10 useful tricks
10 basic tricks to make your pandas life a bit easier

Pandas is a powerful open source data analysis and manipulation tool, built on top of the Python programming language. In this article, I will show 10 tricks regarding the pandas DataFrame to make certain programming practices a bit easier.
Of course, before we can use pandas, we have to import it by using the following command:
import pandas as pd1. Select multiple rows and columns using .loc
countries = pd.DataFrame({
'country': ['United States', 'The Netherlands', 'Spain', 'Mexico', 'Australia'],
'capital': ['Washington D.C.', 'Amsterdam', 'Madrid', 'Mexico City', 'Canberra'],
'continent': ['North America', 'Europe', 'Europe', 'North America', 'Australia'],
'language': ['English', 'Dutch', 'Spanish', 'Spanish', 'English']})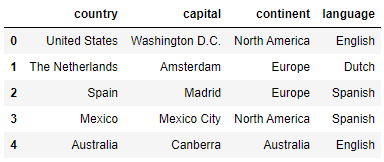
By using the loc operator, we are able to select subsets of rows and columns on the basis of their index label and column name. Below are some examples on how to use the loc operator on the ‘countries’ DataFrame:
countries.loc[:, 'country':'continent']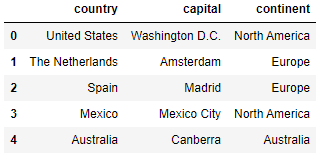
countries.loc[0:2, 'country':'continent']
countries.loc[[0, 4], ['country', 'language']]
2. Filter DataFrames by category
In many cases, we may want to consider only the data points that are included in one particular category, or sometimes in a selection of categories. For a single category, we are able to do this by using the == operator. However, for multiple categories, we have to make use of the isin function:
countries[countries.continent == 'Europe']
countries[countries.language.isin(['Dutch', 'English'])]
3. Filter DataFrames by excluding categories
As opposed to filtering by category, we may want to filter our DataFrame by excluding certain categories. We do this by making use of the ~ (tilde) sign, which is the complement operator. Example usage:
countries[~countries.continent.isin(['Europe'])]
countries[~countries.language.isin(['Dutch', 'English'])]
4. Rename columns
You might want to change the name of certain columns because e.g. the name is incorrect or incomplete. For example, we might want to change the ‘capital’ column name to ‘capital_city’ and ‘language’ to ‘most_spoken_language’. We can do this in the following way:
countries.rename({'capital': 'capital_city', 'language': 'most_spoken_language'}, axis='columns')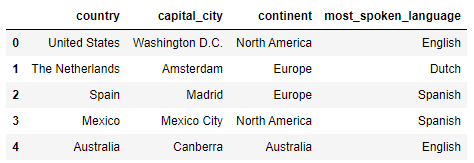
Alternatively, we can use:
countries.columns = ['country', 'capital_city', 'continent', 'most_spoken_language']5. Reverse row order
To reverse the row order, we make use of the loc operator. This works in the following way:
countries.loc[::-1]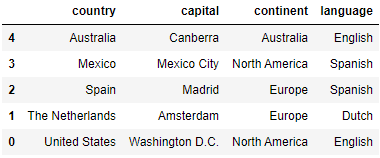
However, note that now the indexes still are following the previous ordering. We have to make use of the reset_index function to reset the indexes:
countries.loc[::-1].reset_index(drop=True)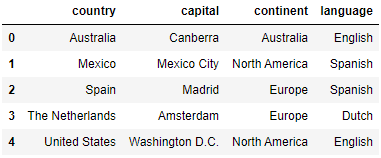
6. Reverse column order
Reversing the column order goes in a similar way as for the rows:
countries.loc[:, ::-1]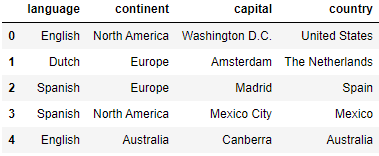
7. Split a DataFrame into two random subsets
In some cases, we want to split a DataFrame into two random subsets. For this, we make use of the sample function. For example, when creating a training and a test set out of the whole data set, we have to create two random subsets. Below, we show how to use the sample function:
countries_1 = countries.sample(frac=0.6, random_state=999)
countries_2 = countries.drop(countries_1.index)

8. Create dummy variables
students = pd.DataFrame({
'name': ['Ben', 'Tina', 'John', 'Eric'],
'gender': ['male', 'female', 'male', 'male']})
We might want to convert categorical variables into dummy/indicator variables. We can do so by making use of the get_dummies function:
pd.get_dummies(students)
To get rid of the redundant columns, we have to add drop_first=True:
pd.get_dummies(students, drop_first=True)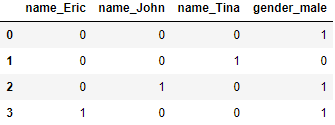
9. Check equality of columns
When the goal is to check equality of two different columns, one might at first think of the == operator, since this is mostly used when we are concerned with checking equality conditions. However, this operator does not handle NaN values properly, so we make use of the equals functions here. This goes as follows:
df = pd.DataFrame({'col_1': [1, 0], 'col_2': [0, 1], 'col_3': [1, 0]})
df['col_1'].equals(df['col_2'])>>> False
df['col_1'].equals(df['col_3'])>>> True
10. Concatenate DataFrames
We might want to combine two DataFrames into one DataFrame that contains all data points. This can be achieved by using the concat function:
df_1 = pd.DataFrame({'col_1': [6, 7, 8], 'col_2': [1, 2, 3], 'col_3': [5, 6, 7]})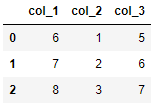
pd.concat([df, df_1]).reset_index(drop=True)Thanks for reading!
I hope this article helped you in some way, and I wish you good luck on your next project when making use of Pandas :).
'Data Analytics(en)' 카테고리의 다른 글
| Please Stop Doing These 5 Things in Pandas (0) | 2020.09.27 |
|---|---|
| Interactive spreadsheets in Jupyter (0) | 2020.09.26 |
| Introducing Bamboolib — a GUI for Pandas (0) | 2020.09.25 |
| Jupyter is now a full-fledged IDE (0) | 2020.09.25 |
| Handling exceptions in Python a cleaner way, using Decorators (0) | 2020.09.25 |